When we launched the Stockopedia StockRanks back in early 2013 we had optimistic but cautious expectations. It was a ranking system formed using fundamental and technical factors that have always paid off in stock markets. But as every good quant knows, even the best designed strategies can underperform for significant stretches of time. Whether we'd get off to a good start or not was, as Ragnar Lothbrock might say, up to the gods.
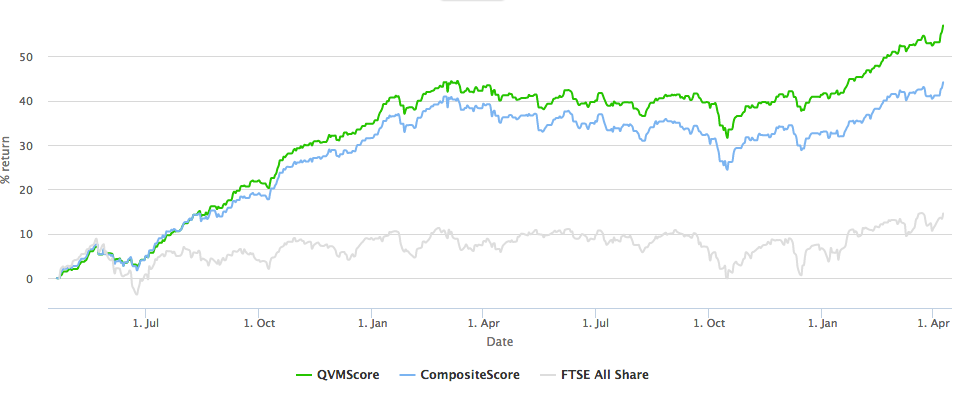
So while the direction of the StockRanks to date hasn't been entirely unexpected, the extent of the outperformance has been rather fortuitious. The 55% return from the top 200 ranked stocks over the last two years significantly exceeded our own internal expectations.
Being of Scottish origin, I've always suffered from downside paranoia. So over the Easter break, aside from spending some lovely time with family, I indulged in a gratuitous analytical deconstruction of the StockRanks. I hoped to gain a better understanding of their nature and the confidence to continue investing in them.
Rules of the hunt
“You certainly usually find something, if you look, but it is not always quite the something you were after." J.R.R. Tolkien, The Hobbit
In designing a ranking system for stocks, you know what you are trying to find… in our case we are searching for good, cheap, improving stocks - but what comes out the other end of the factory may not be quite what was being searched for. After all, if stock markets are efficient at setting prices, then good quality firms should be more expensive than poor quality firms, so trying to find good and cheap companies ought (in theory) to prove impossible !
But I've always thought theory is for the birds, efficient markets are bunk and stock markets are there to be beaten. I want absolute conviction that after we've applied our ranking process we are actually finding the archetypal kinds of good, cheap, improving stocks we set out to, not some wishy-washy mash of stocks where each positive factor has cancelled each other out.
So what I've done is the following:
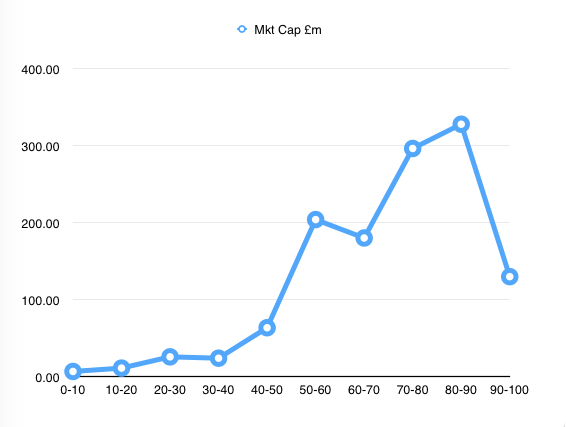
- Sort the entire UK stock market universe by ascending StockRank.
- Chop up these 2000 UK stocks into 10 equal sized buckets (i.e. from StockRank 0-10, 10-20, 20-30… all the way up to 90-100).
- For each StockRank bucket calculate a set of average ratios…