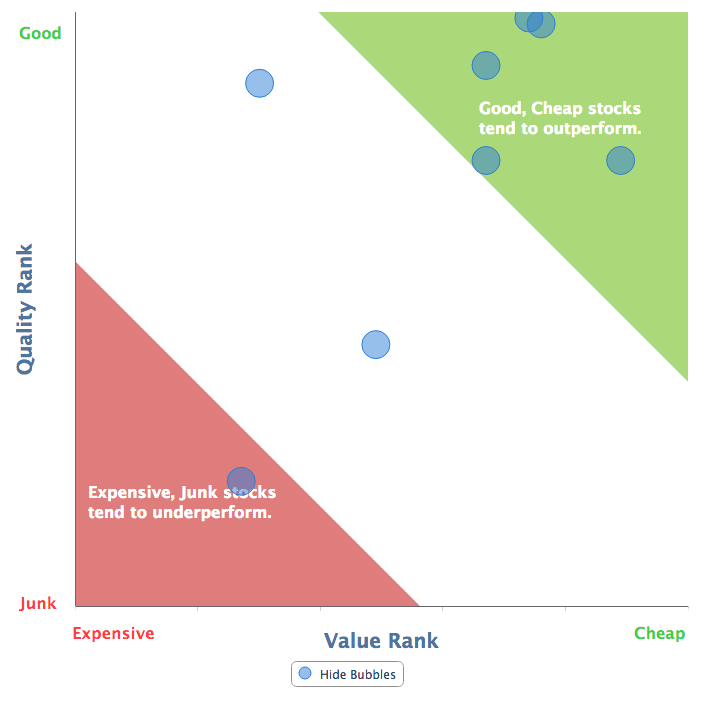
After speaking to many of you at the recent investor shows we've attended, a lot of feedback came in for more clearly defined 'catchment areas' on the bubble charts. We've now adjusted these areas so they mark out 80-100 and 20-0 ranking stocks.
Bubble charts are available on most tables throughout the site; just look out for the views buttons on the right had side.
As always we'll be continuing to make improvements to Stockopedia whilst working hard on our brand new version of the site. This will bring many more features along with an increase in speed and working seamlessly on all devices.