Following from a previous article, I’ll be looking a little further at the impact of some actuarial assumptions. It can be difficult to get your head around some of the ideas the actuaries talk about so a super simplified and visual example is a great way to get a better feel for it all. As such we’re going to be doing some easy present value liability analysis for ‘Company X’, which is in a very unique position.
It only has a few employees, they’re all going to live for precisely 25 years after retiring and the rate of inflation will be precisely 2% from now to eternity. Further, they’re all going retire at exactly the same time and will all receive exactly the same benefit as each other. The accountants have decided to use a discount rate of around 3%, in line with the requirements of IAS 19.
An investor in Company X is unsure about this and wants to know what the impact might be should the number prove to be inappropriate. As such they’ve hired us to do some sensitivity analysis on their pension fund in order to see how varying the discount rate, number of employees and benefit due to employees will affect the present value of their liabilities.
This is, of course, a completely unrealistic scenario and in reality things are much more complex, but it suffices for learning purposes and helps us to isolate a couple of effects.
Varying the Discount Rate…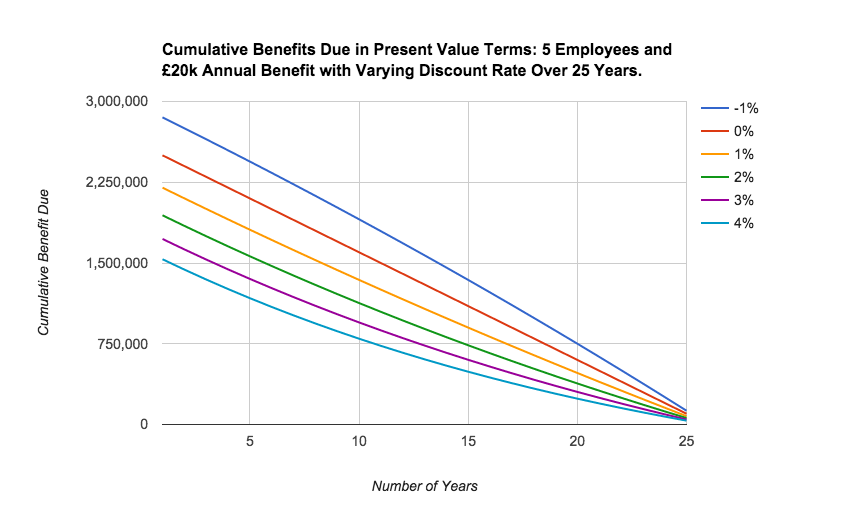
First up, a brief explanation of what the chart is showing (this will be the same for all of the charts). Let’s take the left hand side of the chart where ‘Number of Years’ = 0 on the y-axis. Each of the different colour lines shows us the present value of the liabilities at a given discount rate (inclusive of the effect of inflation, legend on the right).
The value on the y-axis shows me the present value of the benefits due from that date to the end of the 25 years on a cumulative basis. In other words, it adds up all the present values of individual cash flows at that point to arrive at the total still due. As we progress to the right of the chart, the figures fall as the cumulative amount still due falls - this is simply because we’ve paid off some of…