There's much disappointment about the lack of an article on BooHoo today, so I'm going to step in. Prepare to be further underwhelmed.
I'm wanted to see how BOO compared to Asos subsequent to the launch of Boo's app, and you can get the data to do this: a moving average of web traffic from alexa.com and app downloads from appannie.com. I only have the data they give away free. Alexa have just changed their measurement scheme, so that cuts this sequence off.. But for what it's worth, here are 2 graphs..
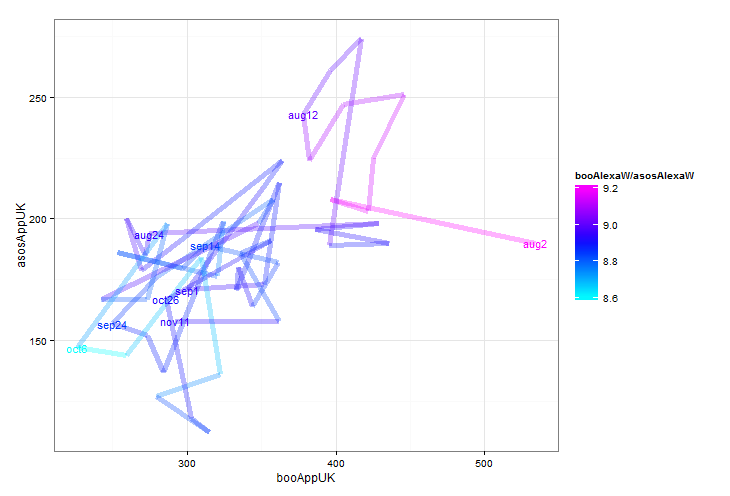
The app launches in early August and its ranking settles at 400, and now hovers at 300. But the points are on a broad diagonal, so any changes in BOO's download rate are matched by changes to Asos's.The colour of the line is the ratio of web traffic - light blue means BOO are stealing ground. BOO had a bit of a relative surge in October.
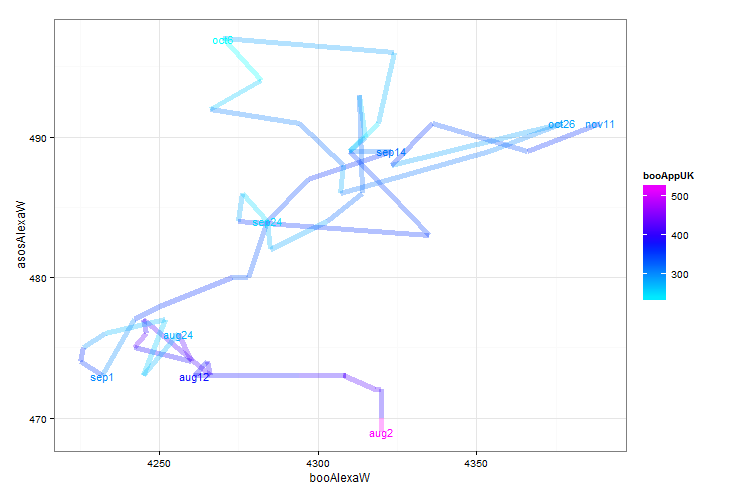
Here are the global web traffic ranks. Again the 2 sites generally move in tandem. There's only a few percentage points movement in any case. The web rank is a 3 month rolling average so, if access to the store goes via an app and bypasses the web you'd expect Boo's traffic to fall as the 3-months starts to cover the period in which the app has been available. On the other hand I understand app purchases incur extra costs from Apple. Swings & roundabouts.
Hope that helps. What, no????