If you wanted to put a trailing stop under your stocks to allow them room to be volatile but to get you out before real trouble appears, where would you put it?
For many people -20% seems to be a 'safe' choice. It is away from the day-to-day noise and by the time you are -20% down it feels as if any further would start to feel like a long way to come back.
But what if we measure typical drawdowns? Can we apply a bit of science to find some sweet spot which will be less likely to take us out on spurious noise but is a good breakpoint before disaster strikes?
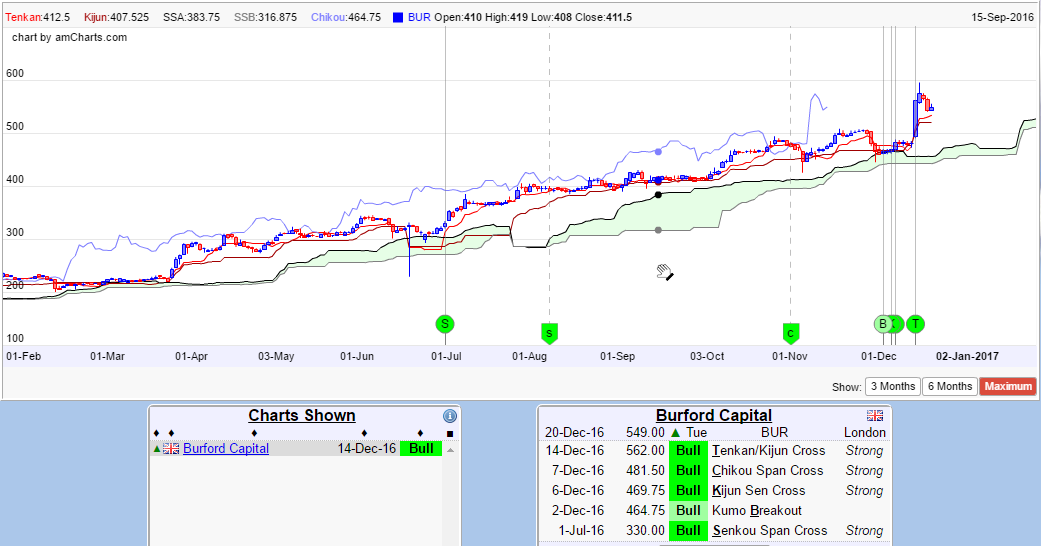
After being surprised by some drops in stocks which I thought were clearly high quality (for example GB (LON:GBG) fell by 38% on what was barely even bad news) I decided to measure how big the drawdown over 256 trading day periods (approximately a year) really is in typical cases.
As they say in clickbait articles, the results will surprise you...
Here is a histogram of the 256-day drawdown for all shares with an MCAP>£100M and spread<5% over about the last three years:
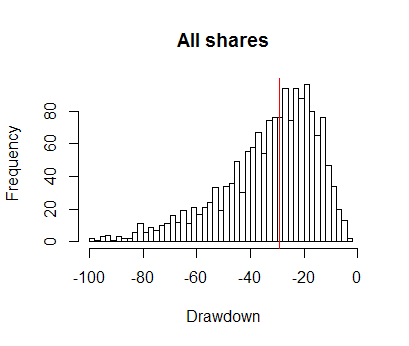
The red line shows the 'median' drawdown is at -29%. That is lower than I expected. In my mind stocks didn't draw down more than -20% unless they were heading for serious trouble.
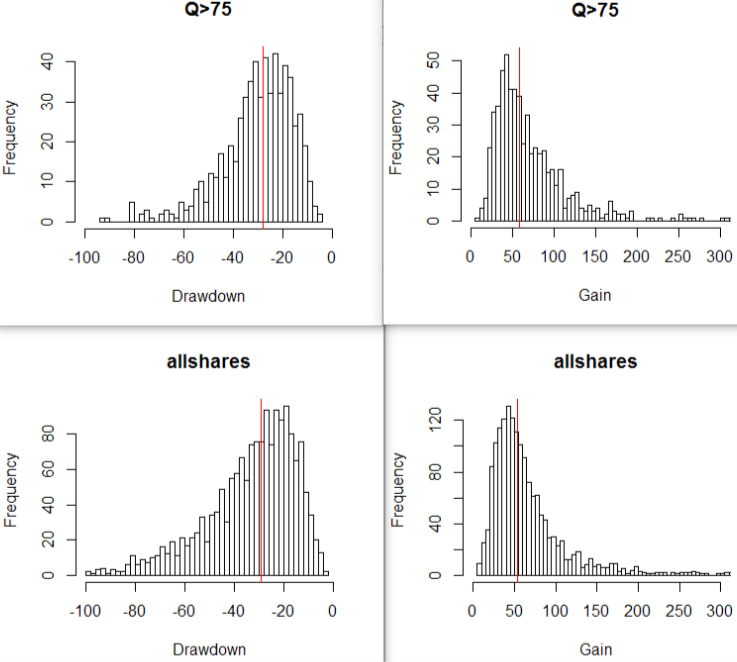
But maybe good, high-Q stocks perform significantly better than this?
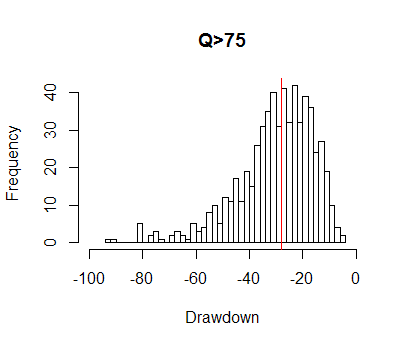
Well, it looks like they are less likely to go bust but the median is now -28%. Hardly an improvement. And why are there little peaks at about -25% and -30%. Are these stocks triggering stops and bouncing back? Let's try Q>85 and see what happens:
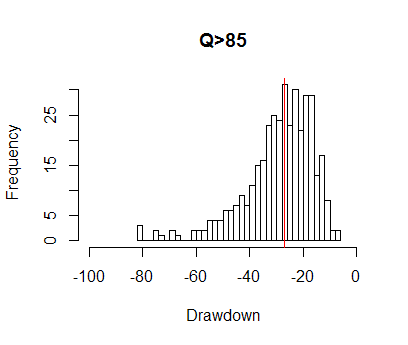
The median is now -27%. It has barely budged. Again there are mild hints that these "good" stocks bust stops at -20%, -25% and -30% and then bounce back. High-Q stocks seem to be less likely to go and have a total collapse, but their high quality does not stop them having very similar drawdowns to any other stock.
Now you might argue that in fact what was happening was that some high-Q stocks were going 'bad' and that is why the drawdown histogram looks like it does. So I simulated 3000 stocks with a daily mean return of…