People say that stocks with low valuation (low P/E, low P/BV, low P/S) are better investment than expensive ones. Is it true? And what does it mean that a stock is cheap? Is P/S = 1 cheap? Or maybe P/S = 2 is cheap? Where is the border of cheapness? Today we’re going to find answers to these questions.
To do this I performed a test. I divided all stocks from the market into 10 portfolios. Let’s call them:
- Extremely cheap stocks
- Very cheap stocks
- Cheap stocks
- Quite cheap stocks
- Slightly cheap stocks
- Slightly expensive stocks
- Quite expensive stocks
- Cheap stocks
- Very expensive stocks
- extremely expensive stocks
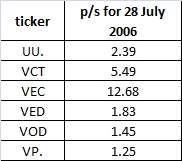
I started from the first date in my data base which is: 28 July 2006. For each stock present on the market that day, I checked what was the value of P/S indicator at that moment. Here is a little piece of the table which I created. Whole has 350 non-trust stocks. (That is the number of all non-trust stocks in FTSE All Share for 28 July 2006. Now it’s over 400).
Later I sorted such created table according to P/S value in such way that the cheapest stocks (fe. P/S = 0.1) were at the top of ranking and the most expensive stocks (fe. P/S = 50) were at the bottom. After sorting, I divided all available stocks into 10 portfolios in such way, that first 10% of the cheapest stocks (which was 35 stocks) went to portfolio “extremely cheap stocks”, second 10% of stocks to portfolio “very cheap stocks”, third 10% to “cheap stocks”, and so on. After that in each of 10 portfolios there were 35 stocks. Each stock had the same position size, so each was not bigger that 3% of its portfolio.
Next I checked how much such folios would earn in next 4 weeks, so between 28 July 2006 and 25 August 2006. I wrote the results down and sold all stocks from all folios. Later one more time I checked what were the current values of P/S for all stocks for 25 August 2006 and on that basis, I created rank and again I divided 10% of stocks to each folio, in the same way as at the first time. After another 4 weeks I checked how much did stocks earn. I did this for each month since 28 July 2006…


