The FTSE 100 today sits at 6,520, about 3% down from the start of the year and about 9% below its all-time peak, so what does that mean for future returns?
Long-time readers will know that I have an obsession with long-term valuation metrics, and so I prefer to use CAPE (cyclically adjusted PE, or price relative to 10 year inflation adjusted average earnings) to do my FTSE 100 valuations and forecasts.
In the long-run the market’s CAPE moves around some central value; sometimes close to it, sometimes far away. But it never strays permanently in one direction or the other. In other words, it reverts back to its mean over time.
In the US the median value over the past century is 15.3 and for the FTSE 100, going back over 25 years, it’s 19.3. The UK dataset is too small to be relied upon so I assume that the UK average is 16, which is probably in the right ballpark.
Over the past century the US market has stayed within half and double its long-term average value 89% of the time. In the UK over the past 25 years it’s been more like 100% of the time. So this range of half to double the long-term median CAPE valuation seems like a reasonable range to call “normal”.
The key insight that comes from realising that the market is mean reverting is that in the medium-term, lower valuations lead to higher future returns than normal and higher valuations lead to lower future returns than normal.
The charts below might help to make these ideas a little less abstract:
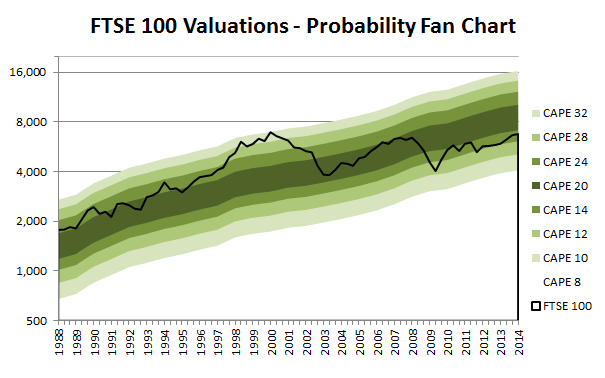
This chart shows how the cyclically adjusted earnings of the FTSE 100 have consistently increased over time. The centre dark green band shows where the market would have been if its CAPE were between 14 and 20, i.e. close to its average value.
The bands get lighter towards the edge to visualise the idea that the market is more likely to be close to fair value, i.e. in the centre of its normal valuation range, rather than at extremely high or extremely low valuations.
Today, the FTSE 100’s CAPE is about 13. That’s below average, although not by much. This indicates that future returns over the medium-term could be better than their…