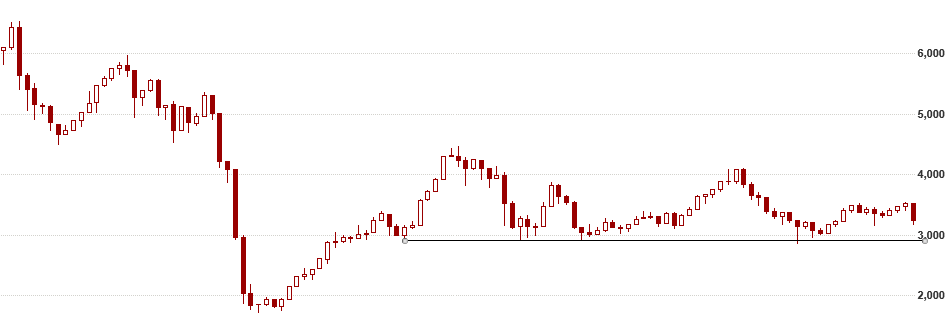
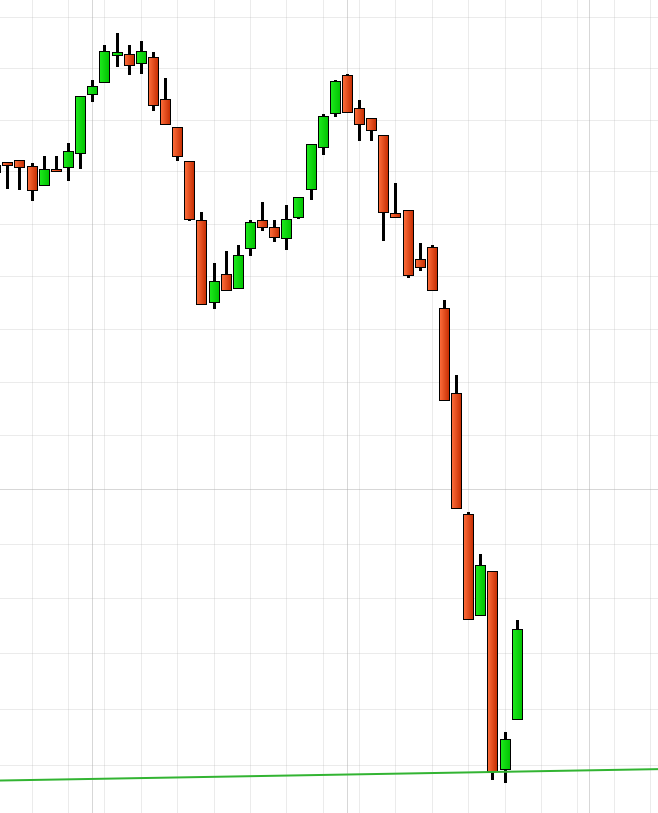
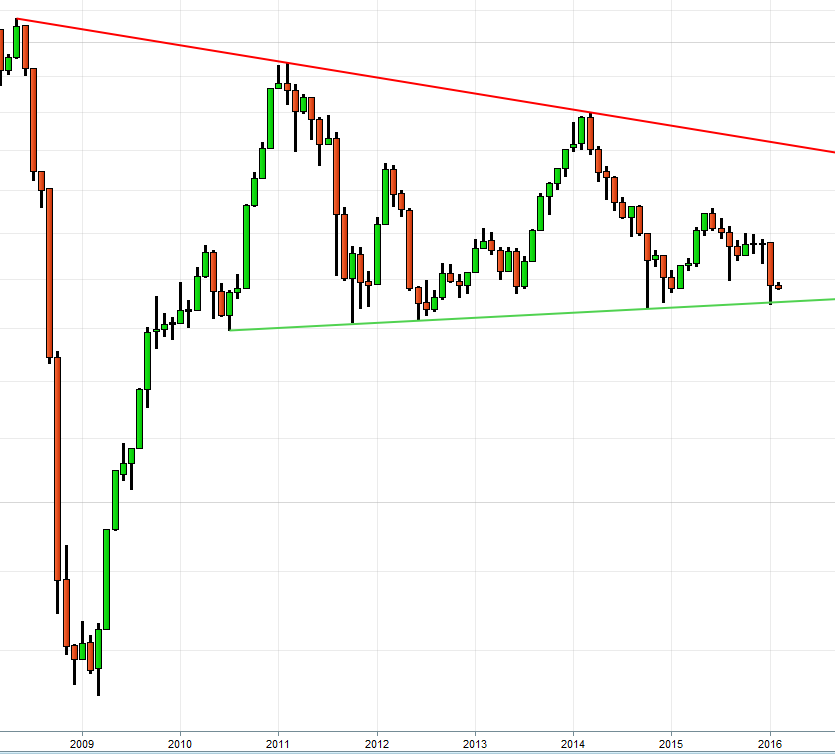
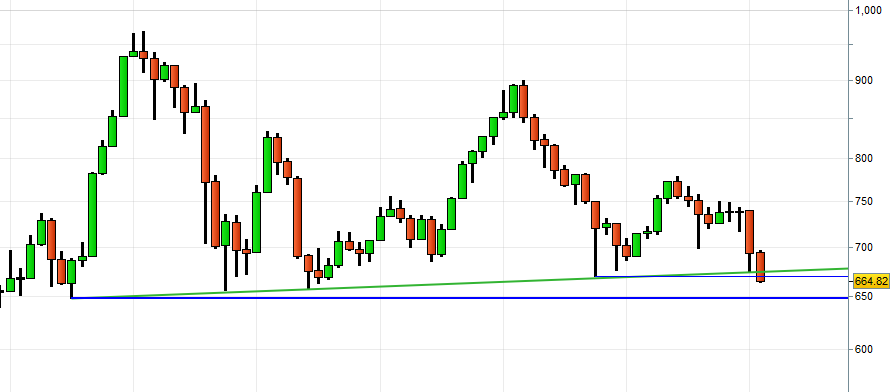
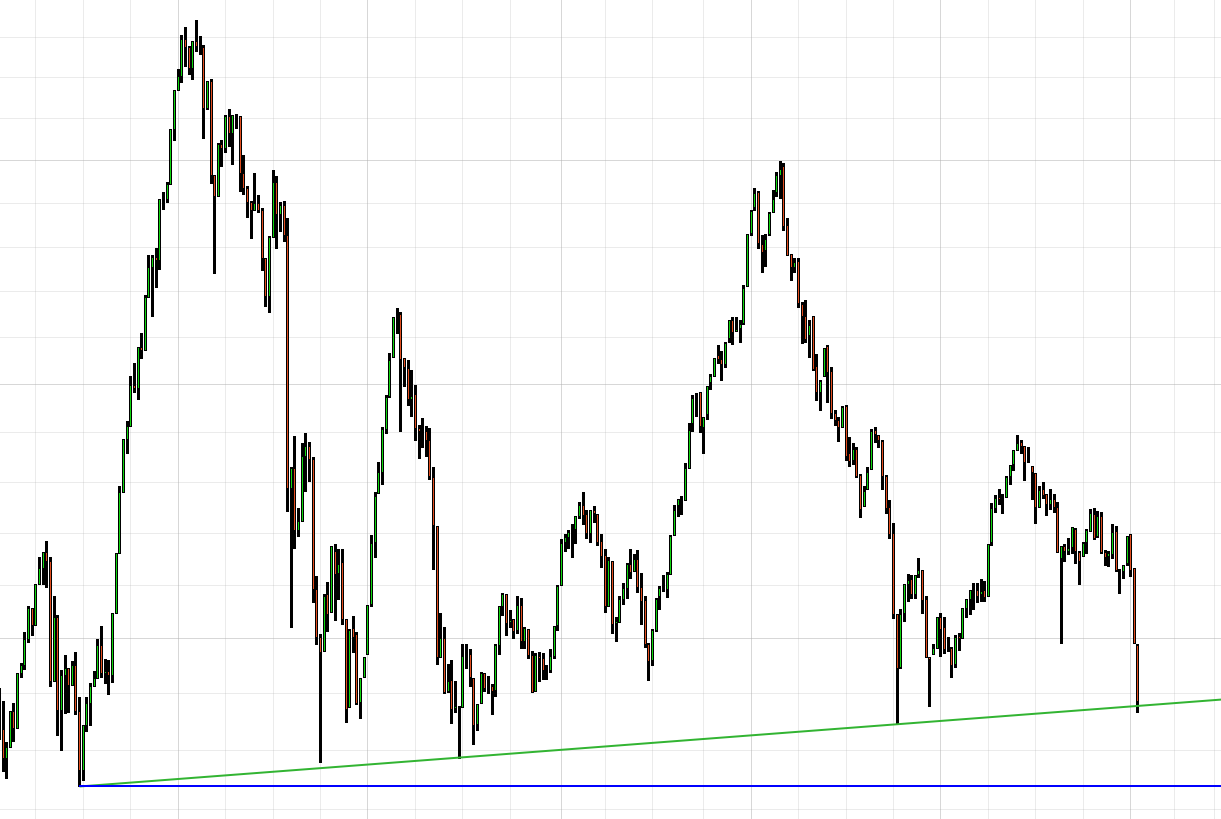
People with an interest in technical analysis and UK small caps will probably already have noticed that the AIM All-Share index has fallen back to a long-term rising support line from 2010 (green line on the chart below).
Support lines enable one to look at the current market situation in binary terms: either support will be "respected" (again), or it will not.
If support is respected this time, the upward-pointing green support line will remain intact, and the ongoing ambiguous market environment (a series of higher lows, but also a series of lower highs) will remain in place.
If, on the other hand, the upward support line does not effectively "provide support" on this occasion, the character of the market will have changed from ambiguous to more or less negative. The key level to watch will be 647.87, the low in June 2010, from which both the green support line and the blue horizontal line are drawn on the chart.
A decisive break of this level (as in a weekly close a few points below the blue line) would indicate a much more negative market environment.
Is all this worth anything in practical terms? I personally would put the value somewhere in the region of "not a lot but not nothing either". I'd be waiting to see what happens with the green support line before committing new money to this market, and if green support "fails" I'd be inclined to carry on waiting, looking for some indication that the market might have bottomed.