How to think about high StockRank stocks

The Stockopedia StockRanks are proving more and more popular, not only as a stock picking guide but also as an educational framework to what works in investing. One of the main goals of the system was to be able to rank every stock in the UK market, regardless of sector or stage of their business cycle, while aligning the site closely with the key findings of academic finance. The exceptional performance of the ranks since launch has surpassed even my own expectations, but their growing influence does mean we have a responsibility to help subscribers understand, and not misuse them.
This post I hope will go some way to clarify how to 'think' about the StockRanks.
Never cross a river because it is on average 4 feet deep
 One of my favorite of Nicholas Nassim Taleb's maxims is that you should "never cross a river because it is on average 4 feet deep". Nicholas Nassim Taleb, as a derivatives trader and the author of "Fooled by Randomness", has an understanding of probability that goes much deeper than most. What he meant was that while averages are extremely useful, they can be dangerous as they don't give any indication of the underlying variability of a distribution. In simple terms, there's a big difference between crossing a river you know is consistently 4 feet deep, to crossing a river that is generally 2 feet deep but has occasional yawning 10 feet deep pools.
This analogy really helps when thinking about the StockRanks. A stock that is ranked 90+/100 scores extremely well across the three key drivers of stock market returns - quality, value and momentum. Historically, over most multi-year time periods, stocks with these characteristics have on average tended to outperform the market. But individually they have zero guarantee of outperforming.
Monkeys with darts
There is an old game in the stock market where brokers give their best picks to the press and go head to head with a monkey throwing darts. The monkey invariably wins. If we took our monkey and asked him to throw darts at high StockRank stocks how would he have done?
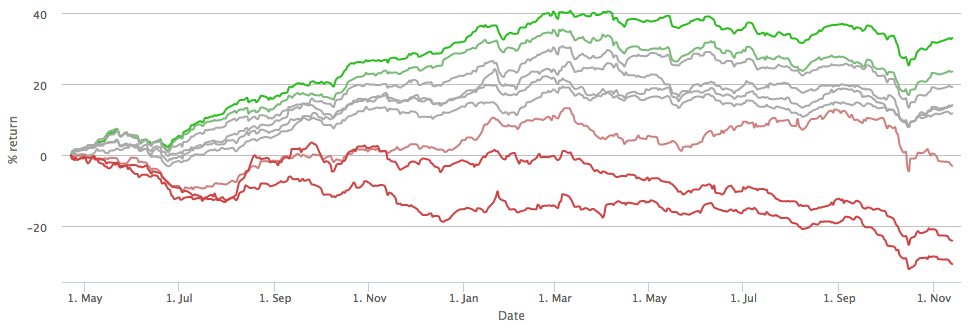
 To answer this, lets go back and look at the performance of the set of top ranking (90+) stocks on LSE since launch in April 2013. Excluding the tiddly microcaps with a smaller than £10m MktCap, there were 134 stocks in this basket. A quarter of them have returned more than 50% since that date. 5 of them have more than doubled, with the best performer being Renew Holdings up 232%. But 19% of these stocks have had underperformed the FTSE All Share, with the worst performer being Synectics down 63%.
On average, the monkey would have done very well. If he'd only thrown a single dart he'd have had a 4 in 5 chance of picking a market beater. But averages, as we've seen are dangerous. The last 18 months have been quite kind to investors. A 1 in 5 chance of picking a loser may not have yet ended in ruin, but in a bad year it very well could have.
Here we come to the key point. The StockRanks only work well if one thinks of them as a 'general tendency' for good, cheap, improving stocks to outperform. These are not buy recommendations on stocks, they are averages. What matters for the StockRanks is the performance of baskets of shares - sets of random 25 stock+ portfolios - not what happens to an individual high scoring share.
Don't overweight precision
Another key point is that a 99 ranked stock may not be, on average (we're learning right?), any better than a 92 ranked stock. If we were to slightly tweak the inputs in our model, the general range of rankings may stay the same, but the precision may well differ. While it's very exciting to find a stock ranked 99 there is absolutely no reason to consider it a more optimal investment than one ranked 10 (or possibly even 20) grades lower.
Running the statistics, stocks ranked 97.5+ have returned 33% in the last 18 months which is the exact same return as stocks ranked 90+. 99+ ranked stocks have returned 36%, but that may well be down to randomness - it's not yet a statistically significant result.
Seeking comfort in troubled, boring, scary stocks
One of my favourite moments during my speech at the London Investor Show was showing a StockReport with the name of the company blurred out. Across almost every fundamental and technical score this stock looked first class. Strong growth, low valuation, good return on capital, low debt, high share price strength and ongoing broker estimate upgrades. A StockRank of 99 and GuruScreen count of 4 added to a compelling investment case - the audience agreed - until I unveiled the company name... Barratt Developments.
One of the reasons that high StockRanks stocks have had a tendency to outperform is that they are not the kind of stocks that people like buying... it's uncomfortable to own them for the following reasons:
- Cheap stocks are often troubled or face problems (investors prefer glamour)
- Good stocks are often boring (investors prefer excitement)
- Improving stocks are often scary to buy (investors hate buying at price highs)

There are behavioural reasons why stocks with these qualities are often underpriced. When reviewing high StockRank stocks it's worth remembering that it's alright if they make you feel uncomfortable - the fear centre triggering may be why these kinds of stocks outperform.
Joel Greenblatt's found that investors using his Magic Formula system, which is designed using similar principles, tended to avoid buying most of the biggest winners and underperformed for precisely these reasons. As John Templeton once said - "If you want to have a better performance than the crowd, you must do things differently from the crowd."
Understanding the distress zone
There has been a lot of discussion lately about the fact that Wincanton has a StockRank of 98/100 when it 'shouldnt'. Our own Paul Scott has been vociferous in his criticism of the company.
A terrible company with an incorrectly high StockRank. They capitalise a large chunk of their payroll into the balance sheet. This is one of the worst companies I've drilled into. It getting a StockRank of 98 is a serious worry.
Wincanton is highly levered and clearly labelled with a high risk of bankruptcy on the StockReport. So why should a stock like this still have a StockRank of 98/100 ? Well it's simple.
Firstly, the QualityRank is only one third of the overall StockRank. If a stock is cheap AND has high momentum then the ValueRank and MomentumRank will outweigh low QualityRank scores. None of the StockRanks trump one another - they are all equally weighted. In fact, according to all the academic literature, quality as a factor is less predictive than value or momentum. My own biggest worry about the StockRanks is whether we should be weighting Quality as highly as we do... as there's plenty of research that suggests that we shouldn't.
 Secondly, and more specifically, while financially distressed stocks as a whole tend to underperform the market, there is a subset of these stocks which do recover. There are various techniques for separating the wheat from the chaff amongst bargain stocks which we've discussed in our ebook "How to Make Money in Value Stocks". One of the best ways to do this is to measure the trend in the fundamentals - whether they improve or continuing to deteriorate. We do this using a nine point checklist called the Piotroski F-Score - companies with improving fundamentals score up to 9, deteriorating fundamentals as low as zero.
The QualityRank is designed to score the quality of a company's franchise (stability, profitability and growth), in tandem with its fundamental trend (F-Score) and its riskiness (financial and earnings quality). The bankruptcy risk is only 1 factor in what we call a multi-factor approach. So the baby is not thrown out with the bathwater in the instance that a company is flagging red on only one signal. It will be thrown out when it's flagging red on them all. The fact that a stock like Wincanton has a positive fundamental trend balances the bankruptcy risk in the scoring system.
While Wincanton may of course go bust, there are no certainties in investing. Statistically, Trinity Mirror was another stock with a very similar StockRank profile (high bankruptcy risk, but strong fundamental trend and price momentum) which more than quadrupled in price... so...
...don't confuse ranking with portfolio construction
If an investor doesn't want to include highly levered or risky stocks in the set of stocks they purchase, they can of course deliberately exclude them from their portfolio construction rules. A simple filter to remove all high bankruptcy risk or highly levered companies from a portfolio would instantly remove a Wincanton from a set of stocks for purchase.
This is precisely the step we've recommended in many of our seminars, and also recommended similarly in the book "Quantitative Value". The authors found higher returns at lower risk by removing these stocks from their strategies. It's really up to you how you wish to use the rankings in portfolio construction.
Being comfortable with the error rate
Barry Ritholtz recently interviewed the legendary James O'Shaughnessy - author of "What Works on Wall Street" and great inspiration to our work here at Stockopedia. In the interview he mentions the fact that all quantitative processes have a built in error-rate.
Some subscribers have been alarmed as this 'built in' error-rate (which is inherent in all quantitative systems) shows that computers are dumb and get it wrong. Others have been alarmed that we have zero qualitative "human" based ratings on the stocks in our system.
 But there's never perfect foresight. One has to remember that human analysts can get it spectacularly wrong. One of my favourite slides shows that the average analyst forecast is 47% wrong on a 1 year basis. We have faith that the error rate is lower in well thought out quantitative processes than it is in qualitative (human based) processes. Maybe in future we'll launch a panel based internal qualitative rating system and put man vs machine to test it out !
But that's in future, for now the key takeaway is to make sure you think about high StockRanks from the portfolio perspective, not from the single stock perspective.
Safe investing !
If you want find out more about the Stockopedia StockRanks - please watch the 1 hour webinar I did earlier in the summer. We are constantly publishing eBooks and guides and will be publishing an ebook on the StockRanks in due course. You can of course take a 2 week free trial at any time to test out our services.
Disclaimer
This is not financial advice. Our content is intended to be used and must be used for information and education purposes only. Please read our disclaimer and terms and conditions to understand our obligations.
31 comments
A quick look at the weekly prices on Google reveals Wincanton (LON:WIN) share price at the the time of the article was 148, it's currently 275, an 86% increase in 3.9 years - 17% annualised.
It's subsequent low point was 148.5, it's high 307.
I guess that's a win for momentum then...
In the light of DX's drop on Friday - it's important to bump this thread back to the top of the discussion stream.
Hi Ed, do you have any idea where the low-volatility premium fits in with this QVM strategy?
The late Robert Haugen wrote a couple of books in the late 90's based on his research showing that low-beta stock portfolios outperform high-beta ones contradicting the CAPM within the asset class (it holds better between asset classes). He postulated that it was the incentive systems of long only fund managers that led them to seek pseudo-leverage through high beta stocks leading to them being systematically overvalued. 'The New Finance' is probably the best and available cheap second hand on Amazon. Highly recommended.
Ah - I think the best Haugen book is "The Inefficient Stock Market" ! Hugely recommended read to non-beginners.
tomomo,
I just read Buffets Alpha - very good and thought provoking. Buffets criteria for high-quality, safe, and cheap stocks served him very well. Could someone suggest a Stockrank based screen that in addition to the Z score incorporates the "Buffets Alpha safe" aspects?
Hi Ed,
Thanks for the answer, very helpful. I did notice that the low ranking stocks are all small caps, and while the majority of them are in long term down trends, a few of them seem to go for 100%+ random walks to the upside, which is not surprising given the territory. Perhaps this is something to consider when once the UK markets start making new highs, before the bubble bursts.
I was wondering, with regards to Beta, do you have any research suggesting better performance with low beta stocks? I see the issue has been briefly discussed on this page but not in much detail.
In your opinion, in the Altman Z2 < 1.8 a good filter against gearing and other financial risks? I've noticed that this filter leaves a list of stocks that, upon inspection, I feel at ease with.
mpat89.
No doubt Ed will have more info on this, but the paper 'Betting Against Beta' by Frazzini & Pedersen to which he refers above can be found at
http://www.econ.yale.edu/~af227/pdf/Betting%20Against%20Beta%20-%20Frazzini%20and%20Pedersen.pdf
The basic idea of the paper is that investors are apt to bid up high beta stocks because it's a way of leveraging their portfolio without actually borrowing to invest. If you go high beta you can get >100% market exposure without investing more than 100% of your account. Elsewhere, in a paper called "Buffett's Alpha", Frazzini & Pedersen argue that Buffett's success as an investor is due in part to his taking precisely the opposite approach -- using leverage but investing in low beta stocks.
John Authers in the FT recently wrote a very interesting article exploring why high volatility stocks are (on average) relatively overpriced. His article links to recent research which indicates that overpricing/underperformance is partially caused by the requirement on fund managers to not fall too far behind their "benchmark".
The crucial point is this: "if a stock doubles in price and the investor [benchmarked fund manager] is half-weight, the mismatch compared to the index doubles; but if the manager is double-weighted and the price halves, the mismatch halves also."
So the market fails to be "rational" (in relation to pricing volatile stocks) not because major market participants are irrational, but rather because they are rationally pursuing a goal other than maximization of risk-adjusted return -- namely, the goal of keeping their jobs by not lagging the benchmark.
http://www.ft.com/cms/s/0/bc78d710-6371-11e4-9a79-00144feabdc0.html#axzz3JtQ8qXiQ
Ed,
What about holding a portfolio of stocks sold short (lets say a basket of 25 stocks)? Basic starting parameter: Stock Rank =< 10. Do your charts show that the value of such a portfolio should tend to zero?
Thanks.
Hi mpat89, the basket of StockRank < 10 stocks has declined by 25% over the last 18 months (as shown in graphic above). One tends to find that the low StockRank portfolio holds a lot more small caps - larger companies tend to be higher quality and ranked more highly - so shorting low StockRank stocks becomes more difficult for spread/liquidity reasons.
A lot of big systematic hedge funds do use long/short equity strategies that aim to e.g. go long value, short glamour. These strategies do tend to work for long periods - though the short side of the trade tends to get quite crowded and bites back viciously every now and then. There was a 'quant meltdown' in 2007 (google it) due especially to overcrowding on the short side of the trade. Not recommended !
There certainly could be an application for using low StockRank shorts as a hedge to long portfolios when the market is overextended. But it's not without its own risks.
Intuitive - just to clarify a couple of points... firstly, the ValueRank is currently entirely backwards looking - there are no forecasts in it at all. Some research has found improvements to Value Ranks using forecast data, but they are quite rare in the literature. The use of historical data has tended to be more robust.
We were more confident in taking this approach in the knowledge that the Momentum Rank is more 'forwards looking' in it's approach - being generally split between Price Momentum and Earnings Momentum - so it would slightly counter any backwards looking bias to the Value Rank. It doesn't though use the absolute level of broker forecasts as an input (which can be very wrong) - only the trend of forecasts - which tends to be more correct. This is a subtle and important distinction - by using the trend we are actually relying more on the fact that brokers tend to be wrong... it's their rate and direction of change which has been shown in the literature to be a more leading indicator.
I hope this clarifies?
Firstly I would just like to say how good I think the website is. Absolute bundle of worthwhile information in a well presented way. I have been investing for over 30 years and am genuinely impressed by the value being offered.
However hopefully as constructive criticism I do wonder about the point of stock ranks. Given the very sensible notice that the devil is in the detail, does a system that is patently not a detail but an aggregate of almost everything really tell anyone about anything?
Stockopedia has an excellent (so far on limited usage) stock screening tool. Surely this is a better tool for an investor to start screening shares in or out.
I accept that it is wonkish fun to come up with multi factor mathmatical calculations, but rather than these perhaps time would be better spent on adding to the general coverage on shares. Perhaps to cover the next tranche above Paul Scott's small caps.
Regards
jpsc01
Ed thanks for posting the link to the Seven Sins of Fund Management, which made utter sense and the reference to the late, great Lao Tzu made me smile.
What is the entry / exit criteria used to graph the basket performance of high StockRank portfolios?
I used 98+ stock ranks for entry because it takes more for their stock rank to fall below 86 or so, which is my exit rule. Stocks in 90-95 make it down to the eighties far more quickly than the stocks 95+
mpat89 - In the chart above - the criteria were the 10% deciles... so the top slice is stocks ranked 90+, the bottom slice 10-. There was a £10m mktcap cutoff in that chart.
There are lots of ways of calculating the performance and it depends how often you rebalance the simulator. The more often we rebalance the portfolio, the higher the performance, but the potential transaction costs rise. We've found that there was a 4% higher performance for quarterly rebalanced portfolios - but that might have been hard to attain due to the transaction costs.
Hope that clarifies.
The main worry I have with the StockRanks is that they're slightly black-boxy -- the explanations available on the site refer to the precise components (mostly) but not to the weighting given to those components.
I'm actually quite happy to trust that the knowledge/judgement used in weighting the components is much better than my own. My worry is more that the element of “secret sauce” means the ranking calculations can never be checked by people outside Stockopedia re-calculating from scratch using the raw input data.
I’ve noticed a couple of systematic miscalculations on Stockopedia (now corrected), and it’s slightly weakened my confidence that the StockRanks are error-free.
Are they ever double-checked by someone independently re-calculating using the input data?
Also: Do you envisage that the methodology for calculating StockRanks will be tweaked in future as anomalies get arbitraged away and academic knowledge increases?
This is the obvious elephant in the room. If this is correct then 47% of Stockopedia's forward data screening (based on analyst forecasts) is also wrong.
What about some screening criteria for analysts who are pretty hopeless? Also further screening /reduced weighting for paid analysts who merely produce Company PR?
Intuitive - if you look at the chart of broker consensus forecasts on any StockReport you'll see quite how much they get adjusted over the course of a 12 month period. It's rare to find any stock that has the same estimates over the course of a year... they tend to look much more like the chart below.
The chart below is from £BDEV - the forecasts have risen by nearly 20% over the last year. I think the key point is that the trend matters more than the value. Brokers have a tendency to act in herds and only adjust forecasts gradually - which is what generates the phenomenon known as 'earnings momentum' - a key driver of share price returns.
I wouldn't say that it means forecasts are 'wrong' so much as it means forecasts get adjusted as new information becomes available. They tend to become more and more accurate the nearer one gets to the actual announcement date.
If you want to read up on forecast accuracy - do buy James Montier's books - he has some terrific references - or google is research papers from his time at Societe Generale. In fact - a more direct link - check out page 9 on this PDF "the Seven Sins of Fund Management"
http://www.er.ethz.ch/teaching/Seven_Sins_fund_Man...
Ed
My argument would be that if 47% of analysts are wrong on a one year basis then they are almost certainly going to be wrong to some degree on most other timescales. Some analysts are just not very good no matter how much time you give them or how often you allow them to update their forecasts.
If you then factor in broker analysts and paid for researchers who are giving a rose tinted view, then it is not perhaps surprising that a lot of analyst research is wide of the mark. Unfortunately this has a greater effect on smaller companies who have fewer analysts and where the house broker/paid researcher has a greater weighted influence.
My slightly provocative post was to suggest that the accuracy of the information producing the Stockrank was more important than a debate on how the Stockrank is used. To my mind the obvious area for improvement are broker forecasts and their weighting.
I like the idea of dynamic graphs using hover over links. For example consider the Altman data (but it could be applied to other graphs too), you could present the graph as the Altman score is now then provide small hover over links for 1m, 3m, 6m, 1yr which when hovered over would change the Altman graph to show the relevant historical value. It's easy then to quickly compare the values by just hovering on/off the time period.
This approach has the benefits that the initial graph is uncluttered but if you want the detail you can focus in on it. The disadvantage is that hovering doesn't work very well on tablets/smartphones.
An alternative might be to use a similar idea on the individual stock's QualityRank, ValueRank, etc component page (which is not currently linked from the StockReport)
The general principle though of clean info but the ability to dig into the temporal aspect is really useful for investors who are interested in using momentum of variables that feed into the Ranks, e.g. Quality (Altman) or the ranks themselves.
Another option would be to animate the portfolio QvM, QvV, VvM bubble graphs over time. The ability then to isolate a specific stock and watch it's progress would be very useful. Currently I'm using Excel with downloaded data and producing my own bubble graphs and then annotating them by hand by comparing to historic stock reports. Tres clunky and time consuming!
Appreciate that this probably isn't going to happen any time soon with all the other things you have on the burner, but just trying to feed in some options and give you some ideas about how I use the data you provide.
Regards
Phil
Will there be a Stockopedia Stockrank ETF? If not, why not? :-)
Cig - re. StockRank ETF / Fund. I wouldn't rule it out.
While I will always insist that people will get higher returns managing their own money, there are many who really don't want to have the hassle of it. We should have a solution for them... we do get a lot of requests for an ETF or fund - so watch this space.
Hi Ed,
Good article and interesting that you mention quality not being as predictive as V&M. In another post or a reply the other day you also mentioned the low beta / betting against beta etc. Saw an interesting article from Research Associates (Rob Arnott et al - about multiple factors and how they have worked or not) and they suggest Value, Momentum & Beta - perhaps time for a VMB measure too or I guess we can just use V & M or VM and filter for low beta like this one I prepared earlier.
Keep up the good work.
Website: jCompound Income
Twitter: @CompoundIncome
Well it all depends on context really. The "Low Volatility" anomaly is gathering steam... it's also a very easy sell to wealth management clients who are scared of stocks. Fund managers hate low vol stocks as they can't hit their bonuses with them, so there's plenty reason for the anomaly to continue.
We've weighted the 'predictive' factors more heavily in the QualityRank - especially the F-Score and Gross Profitability. But every anomaly has a tendency to be arbitraged away so it's a moveable feast.
The same authors as the Betting against Beta research also published the "Quality minus Junk" paper and found that the QMJ factor was pretty good... we've found that Quality has outperformed but not as much as Value or Momentum to date.
We will though be releasing a StockRanks hierarchy at some point in the next 12 months... which will allow more granular screening. And I hope one day subscribers will be able to compose their own ranks - but a bit of a way off right now.
It would also be useful to have the Ranks clickable (they're currently not hyperlinked) on a StockReport to quickly bring up the window that shows how that are constructed for that particular stock. It's a real PITA otherwise.
Yes agreed a graphical representation of the acceleration/deceleration in the various ranks would be useful.
Regards
Phil
Phil - we are working on a few of these ideas. The problem is that the complexity of some of the ranking calculations doesn't really allow for simple representations. You can though have a play around here with a ValueRank spider chart - http://www.stockopedia.com/toolbox/spider/?ticker=LON%3AABC
It's not 100% correct, but it gives a flavour of how it's composed.
Hi Ed,
The spider diagram is nice. It might useful to overlay a version from 1m, 3m, etc. in different colours (with transparency) to show changes over time. I do think it would be much more useful in the 1st instance to hyperlink the StockRank, Q, M, V Rank values on each StockReport to the page that describes how they are constructed for the stock in question. It's so simple for you to implement and is a real pain.
I personally wasn't after a breakdown of each rank (though it is useful) rather I was after a sense of the direction of StockRank, Q, V, M etc.
e.g.
Quality 90 +5 7d -3 1m -5 3m
(or a more graphical and intuitive representation) to indicate a score 90 today, which has risen by 5pts in the last 7 days, dropped over the last month by 3pts and 5pts over the 3 months period.
The timescales are interesting though as the Quality metric tends to shift after interims are reported, whereas Value and Momentum wander as the price shifts and broker estimates are updated.
Hi Ed,
On the subject of stockranks, one of the ideas I had for my screens was being able to compare stockranks at different points in time. In particular in relation to the momentum rank a good screen would be to compare the rank now versus the rank x months ago. I am pretty sure this is not available now but is it something that could be built?
Many thanks
Ric
The "StockRanks Changes" page does allow this - it's highly 'beta' and not yet released. But have a look here:
http://www.stockopedia.com/stockranks/changes/
We'll hopefully be releasing this soon.
Hi Ed,
As you presumably have the historic ranking data and the technology to display graphs like the excellent estimate revision one. To provide what PhilH and maybe others might be interested in - would it be possible to bring up in a box a graph similar to the estimate revision one to show the trend in the relevant score over the last 12 months when you hover over it perhaps? Or thinking on the keyboard how about replacing the useless (?) map of where the Company is based or using the spare white space in that section with a graph of the the trend in the scores which would then sit nicely beneath the estimate revision graph on the StockReport?