This is just a quick post to let Stockopedia subscribers know about some new advances to the website's Technical Charts. The feedback we get from subscribers is that they want to make Stockopedia their financial home on the web, and not have to click away for either their news or charts elsewhere and we are determined to put these essential features in place to make this a reality.
As of today, we have shifted away from using third party charts in order to bring all the data and chart provision under our roof. We've listened to the features that subscribers want and have built a full featured package that leverages both the robust price history data we source from Thomson Reuters and the design expertise we have in house. We now have the platform to extend our charting coverage across all of Europe's securities (and potentially the world) and ensure the reliability of the data.
We have noticed many pricing errors across third party chart packages - especially those offered by some of the global free to air websites. We hope that by bringing the responsibility of our charts under our own roof we can ensure much higher quality for subscribers as we build and extend coverage.
Here are some key improvements we've released today.
Overlays, Moving Averages, Indicators and Chart types
We have added an array of new technical indicators to the package with some well defined default settings. We know that power users will eventually want to create their own custom settings for almost all indicators (like RSI, MACD etc) but for now we have set well defined default settings. Many users are intimidated by difficult interfaces so we've kept things simple enough but no simpler.
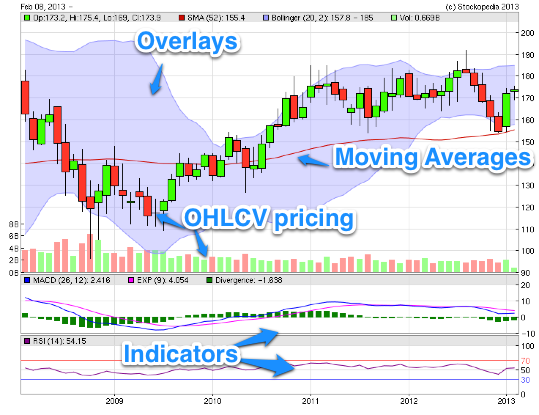
We've added a glossary for all the terms used which we anticipate will grow over time. Many of the indicators I don't use myself, but our team has gathered and researched your feedback to create the algorithms and settings needed. You can read up on some of the Chart Types, Overlays, Moving Averages and Indicators available at our charting glossary or just try the options at the side of the charting package.
Custom Chart Settings