There aren’t many AIM-listed mining stocks whose shares have risen consistently since 2010. But I think it’s fair to say that Kazakhstan-focused copper group Central Asia Metals has managed this impressive feat. The line along the bottom of this chart is the AIM All-Share index, which has risen by just 5% over the same period. Index investing has its limitations!
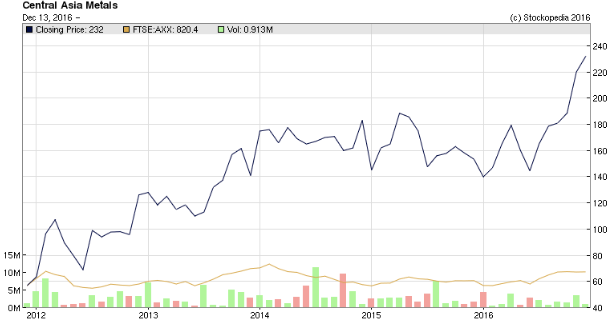 Central Asia Metals’ main asset is the Kounrad mine in Kazakhstan. It also has a 75% stake in a copper tailings project in Chile. One of the group’s main attractions is that its production costs have fallen sharply this year, thanks to the devaluation of the Kazakhstan Tenge.
As a result, this company has fantastic profit margins. During the first half of this year, the average copper price received was $4,903/tonne. That’s well over double the group’s fully-absorbed costs of $2,136/tonne (my calculation).
To add to its appeal, CAML appears to have funded the development and growth of the Kounrad asset with equity, not debt. Net cash has piled up on the balance sheet and there’s no debt. Shareholders are being rewarded with generous dividends.
Stockopedia’s algorithms are also keen on CAML, which has a StockRank of 98. The company qualifies for six Guru Screens, and has also now showed up in my Stock in Focus screen.
Should I add Central Asia Metals to the SIF Portfolio? My only other mining exposure is through gold miner Pan African Resources, so I’m not overweight in this area. But I do still have some concerns:
- Heavy exposure to a relatively esoteric and (for me) poorly-understood currency and jurisdiction
- Am I too late for the big gains?
- Is CAML really as cheap as it seems?
Let’s take a closer look.
The valuation looks promising
CAML’s ValueRank of 62 is the lowest of its QVM ranks. But the shares do still score well in several areas:
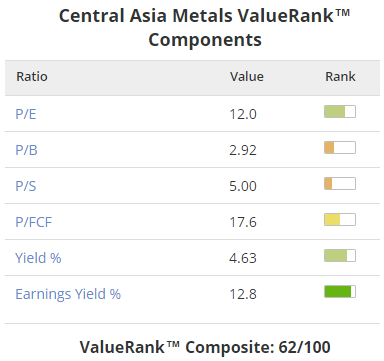
CAML’s P/B of 2.9 makes it clear that the company is being valued on its earning power, not the book value of its assets. So how profitable is this business? The earnings yield (EBIT/EV) of 12.8% is well above my screen’s minimum of 8%, and is a big attraction.
A trailing dividend yield of 4.6% is also appealing, especially as the trailing price/free cash flow ratio of 17.6 implies that…