In Part 9, we dug into the world of price patterns. This week, in Part 10 of our blog series, we explore a common method used in the world of maths and finance to find trends in data; that of moving averages. The moving average is a highly effective, multi-purpose tool that can enhance your technical analytical abilities.
What is a moving average?
The official definition from the technical analytical world gives it as :
‘A moving average is a constant period average (usually prices) that is calculated for each successive chart period interval. When plotted, the moving average shows a smooth line representing the successive, average prices.’
Quite simply, it is a tool for 'smoothing' out the noise from a set of price data over a given period of time. In its raw form, the moving average overlays the price chart.
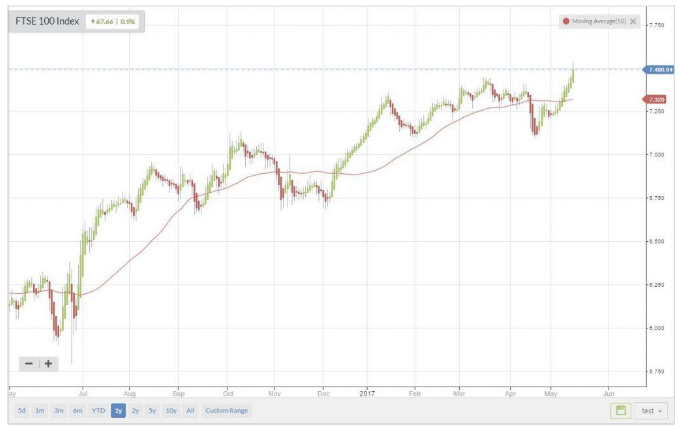
An example using the FTSE 100 (Chart: Stockopedia) with a 50-period moving average - note how the current uptrend is easily defined by looking at the moving average:
Applying the moving average to your technical analysis
In my opinion, the moving average is a great tool for:
Trend determination.
Finding support and resistance levels.
Some basics:
The moving average can be applied to any time period on your charts e.g 1min, 30min, 4hr, 1day etc.
Length of time interval: describes the number of (n) inputs (prices) used to calculate the average.
Can be based on high, low, open but more commonly, close.
Period selected reflects investors' time horizons.
What periods are best to use? This depends on how quickly you want trade signals.
Types of moving average
There are many types of moving average; essentially, they are all a lagging indicator due to the nature of their calculation. This means that the moving average will always miss the early part of a trend and only become useful as a trend determining tool, when prices are moving in a consistent direction.
The moving average used on the FTSE100 chart above, is a moving average known as the 'simple' moving average. This is probably the most commonly used, as it is the simplest to calculate. It is constructed by adding a set of data and then dividing by the number of observations in the period being examined. If the average is moving upward, then this is designated as an upward trend and if the average is falling,…