In the last article we looked at Fibonacci. In part 14, we look at something that is visually similar: Pivot Points. I find that Pivot Points are one of the best tools for trading intraday FX or Stock Market Indices. Like Fibonacci, they give you a road map for price support and resistance. At times they behave like magnets towards the price action and because of this, a trader can use these pivot points to anticipate future short term price action. They can be used in the longer term, but in my experience, this approach isn't so popular.
Application
The main use of Pivots is to show, very clearly, levels of price support and resistance. This information can then be interpreted and used as either useful price target points or for setting risk management (stops) levels. I find them excellent on charts less than 240 mins. Anything greater and I switch back to Fibonacci. The pivot points are placed on top of the price.
Pivot calculation
It is a very simple calculation. To get the main / initial base line Pivot point (PP) you calculate (High + Low + Close) / 3
Further support and resistance levels are then calculated off the main pivot point (P):
First resistance (R1) = (2 x P) – Low
First support (S1) = (2 x P) – High
Second resistance (R2) = P + (High – Low)
Second support (S2) = P – (High – Low)
Third resistance (R3) = High + 2(P – Low)
Third support (S3) = Low – 2(High – P)
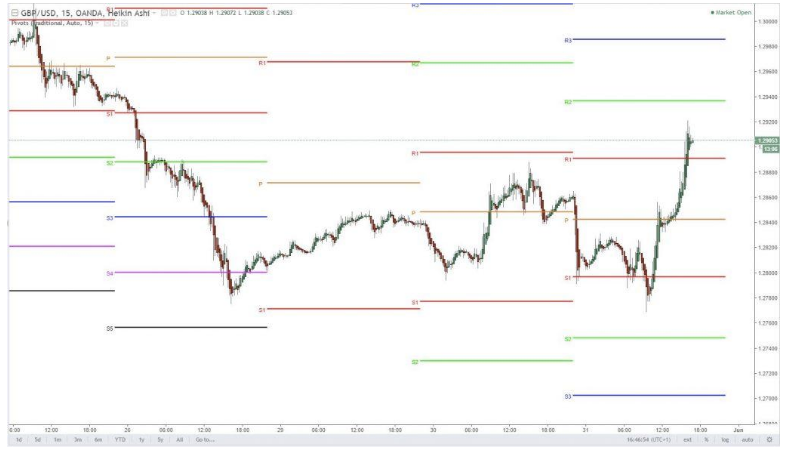
When drawn on a chart, a typical example could look like this:
GBPUSD 15 minute chart (Chart: TradingView)
Basic pivot point rules
This isn't an exhaustive list of rules, but they should help you to get a better handle on using pivot points:
If the opening price > P = look for long trades.
If the opening price < P = look for short trades.
Always identify the long term trend first. Often, if the market is ranging, the price will fluctuate between PP and R1 or S1. With a stronger trend, pivot levels are broken more easily.
Profit targets are often the next pivot level.
Stop losses are set the other side of pivots or behind the moving averages / trend lines - but beware the stop hunters!.
Never anticipate a breakout or reversal of a pivot point.…