Renko charts, discussed in the previous article, should have given you a whole new perspective on how to analyse and trade chart data. In article 21, we are going to look at another form of Japanese chart that helps you to spot reversals! Calling the turn (reversals), when trading any financial market, is a notoriously difficult thing to achieve with any given consistency. There are thousands of different technical analysis tools and techniques that try to give you this edge. One of the best and most simple I’ve come across is the Line Break chart.
What is a line break?
The line break is a very useful Japanese style chart configuration that takes out a lot of the guesswork from calculating turning points in a chart. It works across all assets and most time frames. The Line Break chart, like its cousins the Renko chart and Point and Figure chart, ignores time and only updates when prices move by a certain criteria. In this article we will focus mainly on the 3 Line Break chart which is the most common and widely recognised version of the Line Break chart.
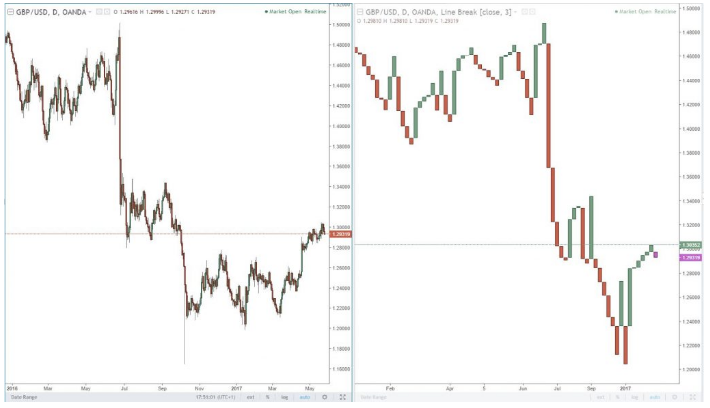
From the two daily charts below on the GBPUSD, notice on the 3 Line Break chart (right), how much easier it is to spot reversals in the price and how much ‘clearer’ the data looks over the traditional candlestick chart (left):
Setting up your 3 Line Break chart
It is a chart made up of vertical lines: one colour for up (bullish), the other for down (bearish). Prices continue in the same direction until the reversal criteria is met. When does a reversal occur? The rule is very simple. When the closing price exceeds the high or low of the prior three lines. Note, that the ‘lines’ are based on closing prices and not ranges of prices e.g. high/low. This style of charting works well in any time frame.
Trading using the 3 Line Break chart
Using 3 lines gives a better confirmation to the trend reversal. A bullish trend reversal occurs when three down lines form and a single up line breaks the high of these three lines. A bearish reversal occurs when three up lines form and a single down line breaks the low of these three lines.