Previously we looked at the Line Break chart which was great for spotting possible reversals. In this article, we look at an approach that can filter out some of the psychological issues you may be having with your analysis. If you’re struggling with the ‘noise’ of the charts and information overload in your trading, then Kagi charting could be just the thing for you to add to your trading arsenal.
Kagi charts were developed in Japan in the 1870’s when their stock market started trading and were used to track the price movement of rice. They were used to give a much more transparent picture of where the price of an individual asset was headed independent of time. Due to the global world we live in and the advancement in charting software, techniques such as Kagi charting are now available to all of us.
It’s all about the yin and yang: What are Kagi charts?
Kagi charts, like their western equivalent the ‘point and figure chart’, do away with time, leaving the user to focus only on the price action. Instead of using ‘X’s and O’s like point and figure charts, the Kagi chart simply uses lines. These lines are known as the Yin and Yang lines. The other fundamental concept of these charts, is that of the reversal in price. The lines change direction once the price moves a set amount.
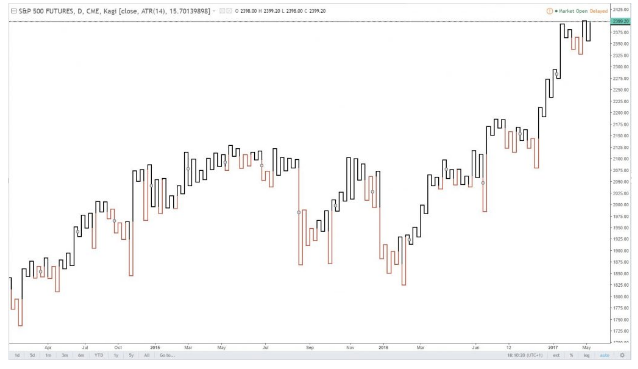
Below you can see a typical example based on the S&P500 stock index (Charts: TradingView). In this example the thicker black line signifies up bullish periods (Yang line) and the thinner red line signifies bearish periods (Yin Line):
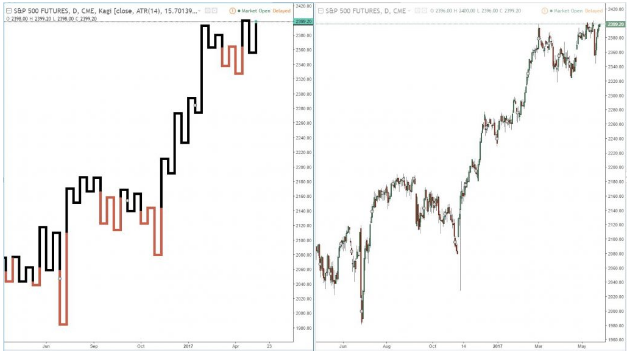
Also take a look at the same period on the Kagi S&P 500 chart versus the traditional candlestick chart S&P 500 chart. See how much less noise there is on the Kagi chart (Charts: TradingView):
Constructing your Kagi chart
Step one is to calculate your reversal amount. This can be done one of three ways:
Fixed number of points
A set percentage move
Average True Range (ATR)
This calculation is not restricted to just the ‘close’, but could also be based on a range such as the high-low. The reversal amount is the minimum price change required for the Kagi line to reverse its direction. If a reversal were to occur,…