Last week in Part 6, we looked at Equivolume. This week, we look at one of the more established and quite straight forward technical analytical approaches to gauging the sentiment of any given stock market: Market Breadth.
What is market breadth?
Market breadth is all about upward, downward and sideways movement and range, principally applied to stocks and their stock markets, to gain an understanding of whether the overall market is bullish, bearish or flat. The concept of market breadth is used to measure the 'health' of any given stock market.
Many who analyse the health of a stock market, often use certain indices to form a subjective opinion. For example, you may take the FTSE100 in the UK or the DJIA in the US to give you a perspective on what the general US or UK markets are up to. There can be a problem with this approach though, which is what has led to the development of breadth indicators.
The main problem is that at some point, or maybe not at all, a stock index does not accurately reflect the general health of the overall market. This could be because the actual index being used only accounts for a small percentage or is not an influential part of the overall market. Or it could come down to how the index is constructed: Are its components heavily industry specific? Is its calculation weighted or how has its make up changed over the years?
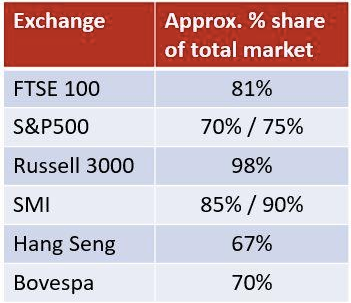
Some examples of the approximate weighting shares of various indices' value to its total market:
Over time, various approaches and tools have been built to compensate for just a straight indices health check approach. These indicators are a derivative of price and volume.
In the stock price movement camp we have indicators such as:
New highs vs new lows
52 week highs and lows
Stocks > a given moving average
Advance / decline line - and its derivatives
McLellan oscillator
In the volume camp we have, for example:
Up and down volume
Arms Index
Other methods could include comparing indices from the same market and comparing how they diverge e.g. S&P500 vs Nasdaq100 vs Russell 3000 etc. Or by comparing their relative strength to one another, or for that matter, taking a more global view by adding in key markets to gauge global economic equity strength.
On your daily trading journey you may…