PCA (Principal Component Analysis) is a statistical technique that can be used to identify the main factors (components) which account for the variance between a set of observations. It has been applied to human personality traits to establish the five factor model and it has been applied to political leanings where we find there is really only a single big axis (left-right) with other components very much smaller.
In MPT (Modern Portfolio Theory) we work with a covariance matrix of stock returns and use it to try to minimise the variance of the portfolio. This is the mathematical equivalent of using diversification to spread risk. So I thought it would be interesting to look at the principal components of this matrix (using the FTSE100 over a 256 day period) to show graphically how the risk gets spread and also to show where a naive sector-based approach to diversification can sometimes be misleading.
PCA is purely mathematical technique and the fun starts when you try to interpret what the components which it reveals might really mean. This short post is not intended to get to technical or academic though. So I'll have a go at some cod analysis but mainly it is intended to provide a bit of fun over the bank holiday weekend.
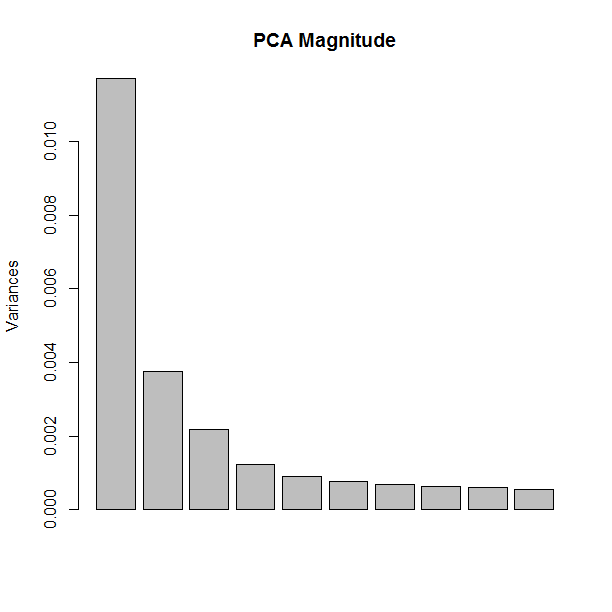
The first report is called a "scree plot" and it shows the magnitude of each component it has found. (These magnitudes are called the eigenvalues). For an analysis of 100 stocks there will be 100 components altogether but the plot below only shows the first ten.

You can see that they get rapidly smaller towards the right. The biggest components here have the greatest effect on how a stock varies. The first and largest component here broadly corresponds to whole-market movements (the beta for each stock) and for this quick look is not very interesting.
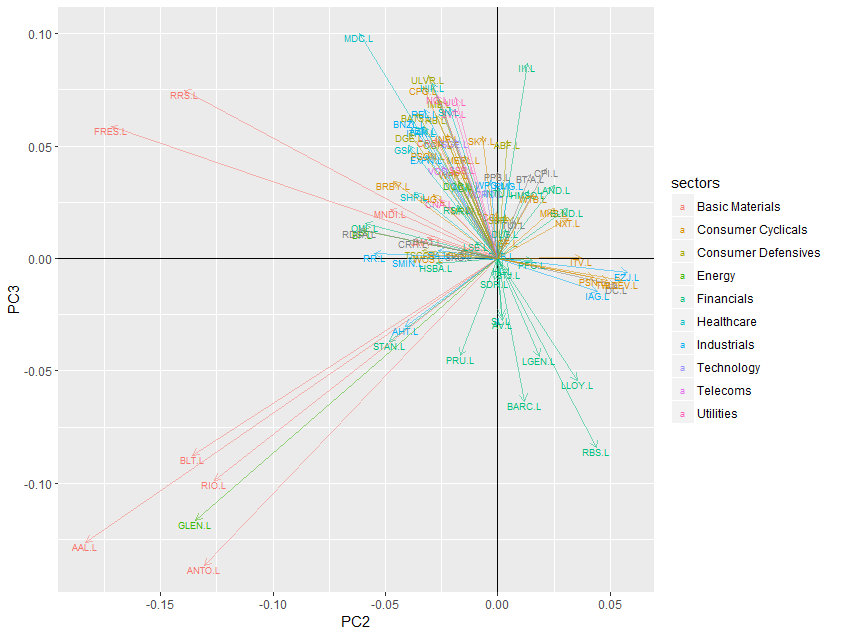
So let's plot the second and third components against each other (PC2 and PC3 in the plot. This is called a "biplot" in the PCA literature.) Right-click/View Image to see a bigger version.

We can see that Anglo American (LON:AAL) Antofagasta (LON:ANTO) Rio Tinto (LON:RIO) BHP Billiton…


