Are there accounting red flags at Fevertree Drinks PLC (LON:FEVR)?


As an investor, I want to know that I can rely on the accounts of the companies I buy shares in - and I bet you do too.
Accounting errors can be entirely innocent... but sometimes they're deliberately misleading. Either way, the market response is usually swift and severe. Uncertainty about a company's earnings or the way it reports its figures will inevitably cause its share price to plummet.
What most investors don’t realise is that there are algorithmic ways to check the credibility of company earnings - and one of them is called the Beneish M-Score. In this article I’m going to explain how it works by looking at Fevertree Drinks (LON:FEVR) as an example.
About Fevertree Drinks (LON:FEVR)
Fevertree Drinks is a adventurous, large cap in the Distillers & Wineries industry.
In terms of price performance, the Fevertree Drinks share price has seen 1-year relative strength against the the FTSE All-Share index of 2.17%.
When it comes to earnings, analysts are currently forecasting that Fevertree Drinks' earnings per share will grow by 32.7% in the current financial year.
While those figures sound promising, the Beneish M-Score - which I’ll explain shortly - shows that there are areas in Fevertree Drinks' accounts that might be worth closer investigation.
It's important to note that this doesn’t mean that Fevertree Drinks is doing anything wrong. But it does mean that the risks could be higher than for other shares. As an investor, you should know what these red flags mean - both in Fevertree Drinks and any other stock you might be thinking of buying.
How the Beneish M-Score works
In 1999, a finance professor called Messod Daniel Beneish published a landmark research paper entitled The Detection of Earnings Manipulation. It showed how you can use accounting data to spot problems early.
Since then it’s become an indispensable checklist for professional money managers and investment banks - and you can use it too.
Professor Beneish’s M-Score looks at the year-on-year change in eight different ratios that can be worked out from a company’s financial statements. It looks for these red flags:
- Inflated revenues
- Declining gross margins
- Capitalised and deferred costs
- Excessive sales growth
- Lengthening depreciation periods
- Rising sales expenses
- Increasing leverage
- Higher accruals
Ideally, you and I would want our stocks to be passing these checks with ease. But when a company fails one or more of them, it’s time to dig deeper into the accounts to find out why.
Are there accounting risks at Fevertree Drinks?
Here is a graphic that shows how Fevertree Drinks stacks up against the M-Score checklist.
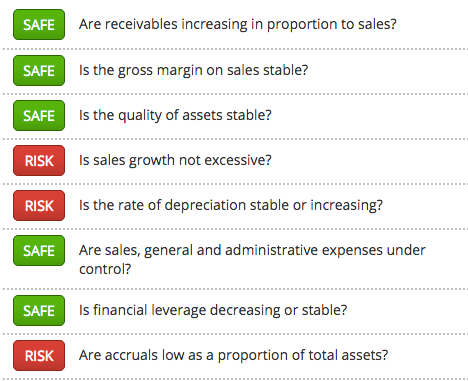
As you can see, there are three potential risk areas based on Professor Beneish's checklist.
Next Steps
To find more stocks like Fevertree Drinks, you'll need to equip yourself with professional-grade data and screening tools to pinpoint the highest quality companies in the market. This kind of information has traditionally been closely guarded by professional fund managers. But our team of financial analysts have carefully constructed this screen - which gives you everything you need.
In less than a minute, you can be exploring a list of stocks with the very strongest financial ratios in the market. You'll be joining us on a journey towards owning the very best quality stocks possible. So what are you waiting for? Come and get started for free.
About us
Stockopedia helps individual investors make confident, profitable choices in the stock market. Our StockRank and factor investing toolbox unlocks institutional-quality insights into thousands of global stocks. Voted “Best Investment Research Tools” and “Best Research Service” at the 2021 UK Investor Magazine awards.