Can Next's (LON:NXT) share price break out?

.jpg)


Next (LON:NXT) is classified as a 'High Flyer' stock: an exciting combination of high quality, high momentum, and low value.
Some of the market's biggest multibaggers were a High Flyer at one point or another, but beware - this is a dangerous (if potentially lucrative) part of the market to play in.
Next (LON:NXT) is a well-known large-cap stock retailer. When we analyse Next from a factor perspective, we find that it has a:
- Quality Rank of 91,
- Momentum Rank of 89,
- Value Rank of only 43.
This is the classic factor profile of a High Flyer.

A combination of high quality, high momentum and low value is great when earnings go up but a bad place to be when things go wrong. The higher they rise the harder they fall, after all.
Next (LON:NXT): flying high but is it safe?
So, High Flyers tend to be riskier and more volatile than the market average. But is this true of Next?
With Stockopedia’s RiskRatings system, which divides stocks into five groups according to stock price volatility, we can get an insight into just how volatile Next's shares are. The five classifications (from most to least volatile) are:
- Highly Speculative (30% of the market),
- Speculative (25% of the market),
- Adventurous (20% of the market),
- Balanced (15% of the market), and
- Conservative (10% of the market)
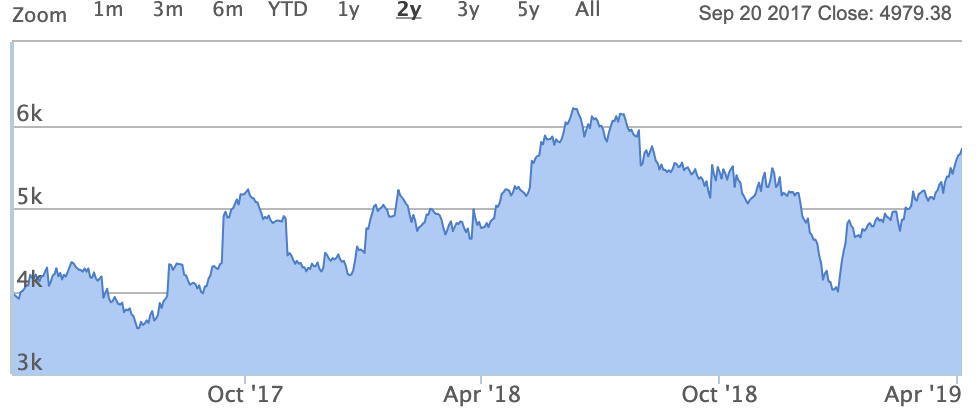
Next is an adventurous stock. This means that the group is in the more volatile half of the market in terms of stock price volatility, as might be expected of a High Flyer. Those looking to invest here should prepare themselves for a potentially bumpy ride. If we take a two-year view of the group's shares, we can see this volatility better:
One thing in Next’s favour is its imressive above average five-year return on capital employed figure of 54.8%. Being consistently profitable to such a degree over multiple years suggests that Next can back up its favourable factor exposures with some kind of economic moat and, hopefully, make any share price volatility more bearable in the short term.
This attractive blend of factors and profitability characteristics has been noticed by the market - Next has a one-year relative strength of 16.5%.
Find the rockstars of the stock market
High Flyers are great stocks to have in your portfolio if you think you need more momentum or quality - just look out for signs that momentum might be changing. If you want to see which other stocks qualify as High Flyers, you can find a comprehensive list on Stockopedia's StockRanks page.
Simple tools can help us better measure and understand the risks we take. That's why the Stockopedia team has been busy building new ways of understanding investment risks and company characteristics. In this webinar, we talk about two or our most popular innovations: StockRank Styles and RiskRatings. These indicators transform a ton of vital financial information into intuitive classifications, allowing you to get an instant feel for any company on any market - sign up for a free trial to see how your stocks stack up.
About us
Stockopedia helps individual investors make confident, profitable choices in the stock market. Our StockRank and factor investing toolbox unlocks institutional-quality insights into thousands of global stocks. Voted “Best Investment Research Tools” and “Best Research Service” at the 2021 UK Investor Magazine awards.