'Golden cross' could signal further upside for shares in Centrica
A new "golden cross" formation on the Centrica (LON:CNA) price chart could be a bullish signal that the shares are poised to break out.
Shares in Centrica are currently trading at 80.5p. Relative to the market, the price has seen a solid 30.0% return over the past six months.
That positive momentum has now culminated in one of the most closely watched signals in technical analysis - the golden cross.
Golden crosses occur when a stock's 50-day simple moving average line moves above its longer-term 200-day simple moving average line. These rare technical moves can be a tell-tale sign to investors and traders that price momentum is picking up. Here's why that's important...
Momentum in the Centrica share price
Price momentum is a proven driver of stock market profits. At a basic level, it represents strong upward price trends that can persist for many months. This momentum is often found in:
- Stocks that are gradually recovering from setbacks or cyclical lows.
- High flying shares that are regularly beating forecasts and surprising the market to the upside.
Accelerating price strength can be a useful pointer when it comes to stock selection and timing trades. In fact, golden crosses are seen by some traders as so influential that they need very little extra confirmation before buying in. But others will use them as an important technical signal as part of a broader investment checklist.
Regardless of your investing style - and even if you have little experience of technical analysis - golden crosses can tell you a lot about changes in trend and sentiment that might be the early signs of a bullish move.
Here's how to find a golden cross formation on a price chart...
How the golden cross works
Much of what you see on any given stock chart is the noise and volatility of day to day trading. What's often hidden is the underlying trend. Yet, it's important to know whether a stock is building support in the market, or whether it's falling out of favour.
The way to solve this is to use moving averages. They work by plotting the average share price over timeframes that can range from minutes to many months. And it's here that the 50-day and 200-day moving averages come in.
By comparing the short and longer-term price trend lines, you can see whether recent price action is more bullish or bearish than normal. If it's more bullish, it could be a signal that the trend is changing - and you might have a golden cross on your hands.
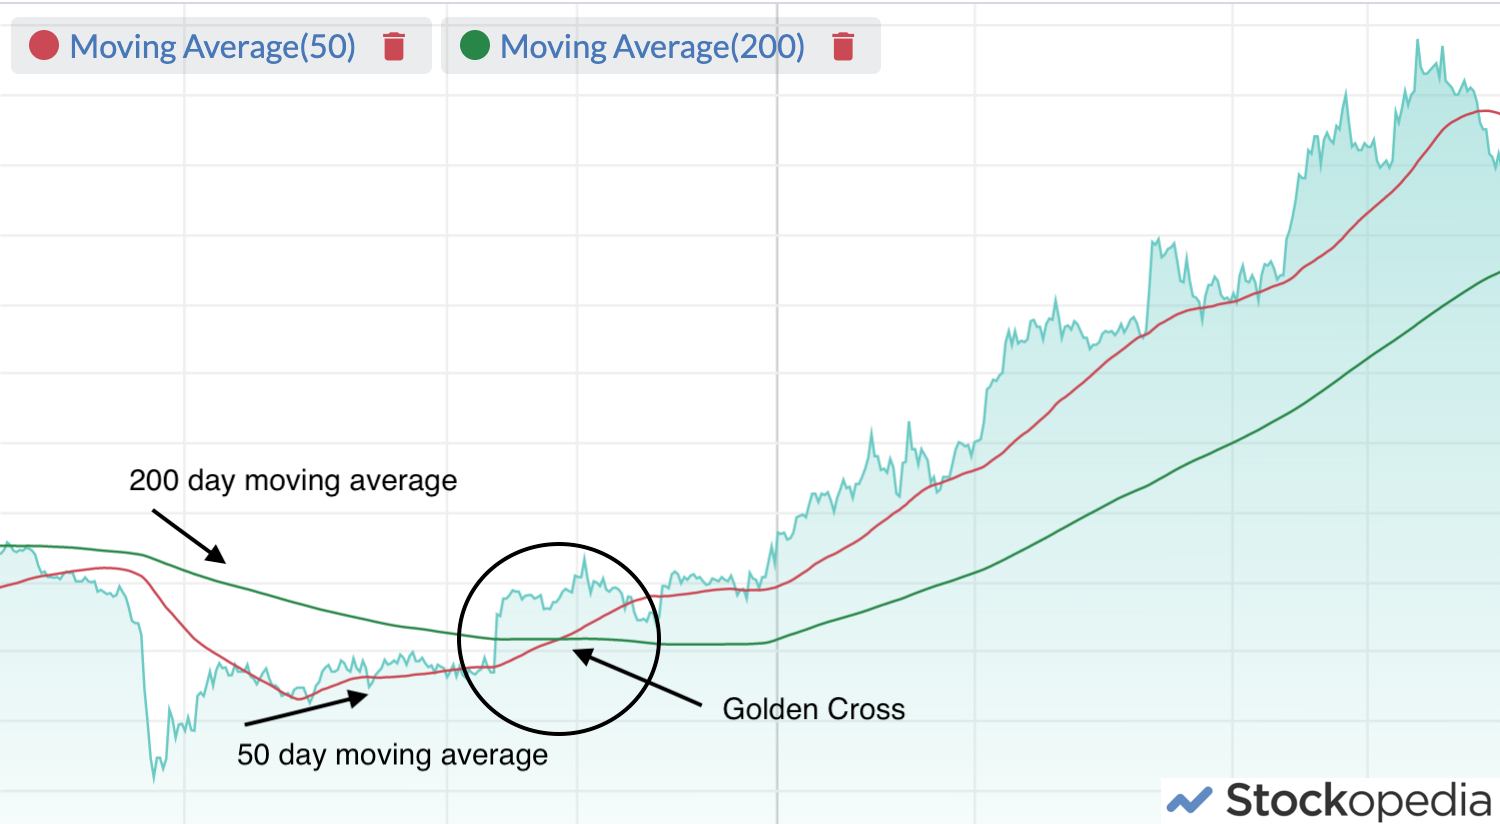
Here's an example of what you might see:

Here you can see how the short term 50-day line (in red) crosses above the longer term 200-day line (in green). This golden cross sets up a period of accelerating price momentum that's very different from the longer-term trend. This rapid re-rating is precisely what investors are looking for.
Next Steps
To find more stocks like Centrica, you'll need to equip yourself with professional-grade data and screening tools to pinpoint the highest quality companies in the market. This kind of information has traditionally been closely guarded by professional fund managers. But our team of financial analysts have carefully constructed this screen - which gives you everything you need.
In less than a minute, you can be exploring a list of stocks with the very strongest financial ratios in the market. You'll be joining us on a journey towards owning the very best quality stocks possible. So what are you waiting for? Come and get started for free.
About us
Stockopedia helps individual investors make confident, profitable choices in the stock market. Our StockRank and factor investing toolbox unlocks institutional-quality insights into thousands of global stocks. Voted “Best Investment Research Tools” and “Best Research Service” at the 2021 UK Investor Magazine awards.
