Four red flags for the D4t4 Solutions (LON:D4T4) share price

.jpg)


Accounting errors tend to be harshly punished by the market. Investors hate uncertainty, after all.
What most people don’t realise is that we can systematically check the credibility of company earnings - and one of them is called the Beneish M-Score. In this article I’m going to explain how it works by looking at D4t4 Solutions (LON:D4T4) as an example.
D4t4 Solutions (LON:D4T4): fast-growing software company
D4t4 Solutions is a speculative, small cap in the Software industry. It focuses on data solutions for its clients to provide end-to-end management of the entire data lifecycle, all the way through to its eventual retirement into industry-compliant archives.
For the six months ended 30 September 2018, D4t4 Solutions PLC revenues increased from £4.7M to £14M and net income totaled £3.4M vs a loss of £383K in the previous period. What's more, analysts are currently forecasting that D4t4 Solutions' earnings per share will grow by 64.5% in the current financial year.
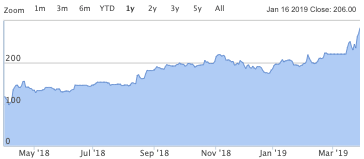
This growth profile has been reflected in the group's share price - the D4t4 Solutions share price has trumped the market this past year, with a 1-year relative strength against the FTSE All-Share index of 126.6%.
While those figures sound promising, the Beneish M-Score - which I’ll explain shortly - shows that there are areas in D4t4 Solutions's accounts that might be worth closer investigation.
How the Beneish M-Score works
In 1999, a finance professor called Messod Daniel Beneish published a landmark research paper entitled The Detection of Earnings Manipulation. It showed how you can use accounting data to spot problems early.
Professor Beneish’s M-Score looks at the year-on-year change in eight different ratios that can be worked out from a company’s financial statements. It looks for these red flags:
- Excessive sales growth
- Lengthening depreciation periods
- Rising sales expenses
- Increasing leverage
- Higher accruals
- Inflated revenues
- Declining gross margins
- Capitalised and deferred costs
Ideally, stocks should be passing these checks with ease. But when a company fails one or more of them, it’s time to dig deeper into the accounts to find out why.
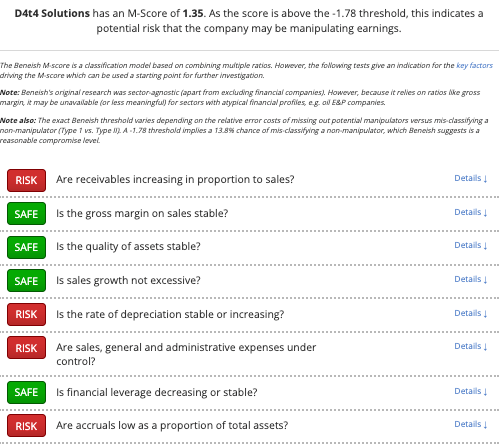
Are there accounting risks at D4t4 Solutions?
Here is a graphic that shows how D4t4 Solutions stacks up against the M-Score checklist.
Next Steps
To find more stocks like Celebrus Technologies, you'll need to equip yourself with professional-grade data and screening tools to pinpoint the highest quality companies in the market. This kind of information has traditionally been closely guarded by professional fund managers. But our team of financial analysts have carefully constructed this screen - which gives you everything you need.
In less than a minute, you can be exploring a list of stocks with the very strongest financial ratios in the market. You'll be joining us on a journey towards owning the very best quality stocks possible. So what are you waiting for? Come and get started for free.
About us
Stockopedia helps individual investors make confident, profitable choices in the stock market. Our StockRank and factor investing toolbox unlocks institutional-quality insights into thousands of global stocks. Voted “Best Investment Research Tools” and “Best Research Service” at the 2021 UK Investor Magazine awards.