How safe is Exxon Mobil’s (NYQ:XOM) dividend payment?

.jpg)


Avoiding big losses is just as important as picking winners - this is why legendary investors such as Seth Klarman always advise prudent risk management. Take Exxon Mobil (NYQ:XOM), for example, which Stockopedia classifies as a conservative super stock company.
Exxon is a global giant, engaged in the exploration, production, transportation and sale of crude oil and natural gas, and the manufacture, transportation and sale of petroleum products. Unsurprisingly, it is a well-integrated operation with Upstream, Downstream, Chemical, and Corporate and Financing operating segments.
Exxon Mobil (NYQ:XOM) pays out a rolling 4.08% of its share price in dividend payments. But sometimes a high dividend yield can signal skepticism from the market. How do we know if we can trust Exxon Mobil's forecast yield?
One way to check is to see whether its financial health is improving or deteriorating. This is exactly what the Piotroski F-Score sets out to establish.
Here's why the Piotroski F-Score matters
The F-Score was created by leading academic, Josef Piotroski, as a simple indicator to highlight stocks with improving financial trends.
What sets the F-Score apart is that it blends quality and fundamental momentum into a number that is easy to compare across companies. Applying it as a filter on top of almost any strategy can help to increase returns and reduce risk. It is made up of nine checks split up into three main areas: profitability, capital structure, and operating efficiency.
Does Exxon Mobil (NYQ:XOM) pass the F-Score test?
Stockopedia applies algorithms to its stream of financial data to automatically calculate the Piotroski F-Score for every stock on the market. It shows that Exxon Mobil (NYQ:XOM) scores 8 out of a possible 9.
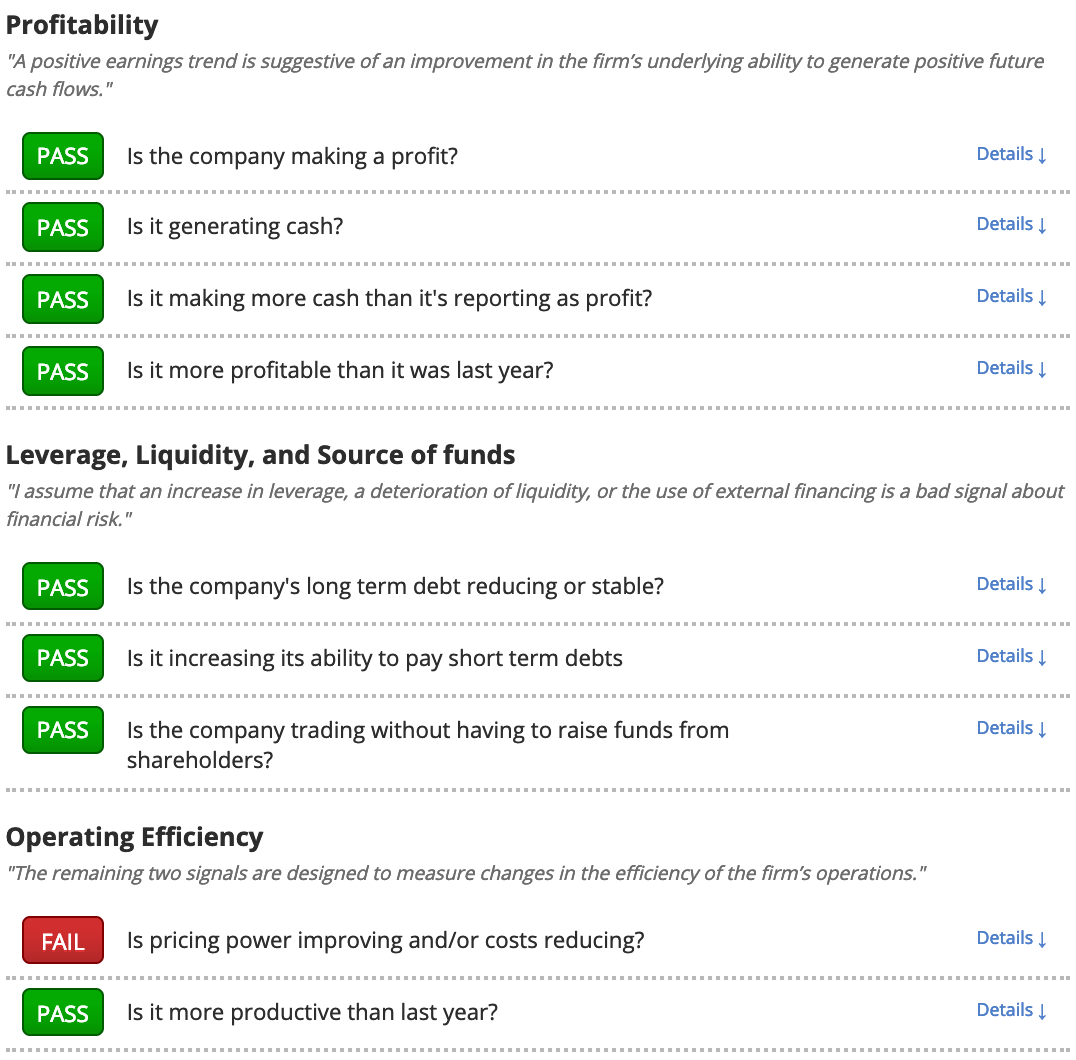
This is clearly encouraging for investors wondering whether to buy Exxon for its forecast yield.
For the fiscal year ended 31 December 2018, Exxon Mobil Corporation revenues increased 18% to $279.33B and net income before extraordinary items increased 49% to $20.55B, suggesting that the company's scale and diversification is bearing fruit. Furthermore, although Exxon's rolling 1-year dividend cover is below 2x at 1.34, this comes after a strong period of dividend growth in which the group has managed to build a 5.57% compound annual growth rate in dividend payments over the last 10 years.
What does this mean for potential investors?
Exxon Mobil has an F-Score that suggests it could be a promising investment candidate worthy of further research - but it's only a first step. Higher F-Score stocks can still have weaknesses and may trade at premium prices compared to other stocks. We've identified some areas of concern with Exxon Mobil that you can find out about here.
About us
Stockopedia helps individual investors make confident, profitable choices in the stock market. Our StockRank and factor investing toolbox unlocks institutional-quality insights into thousands of global stocks. Voted “Best Investment Research Tools” and “Best Research Service” at the 2021 UK Investor Magazine awards.