This week we focus on stocks listed on the London Stock Exchange instead of American stocks. There are two reasons for that. One is that we are not limited to American stocks only when it comes to auto-generated algo-based technical analysis and recommendations. We cover stocks for 12 countries worldwide. The second reason is that we found some interesting stocks listed on LSE that could turn out to be good bets in the coming weeks and months.
We first chose some criteria, based on which we found three stocks. Under our stock selection option, we filtered for liquidity, set at 75 million pounds or above, volatility between 6 and 16, so we do not end up with very low or very high volatility stocks, and lastly if they were technically positive or negative.
CENTRICA PLC (CNA.L) Close: 153.10
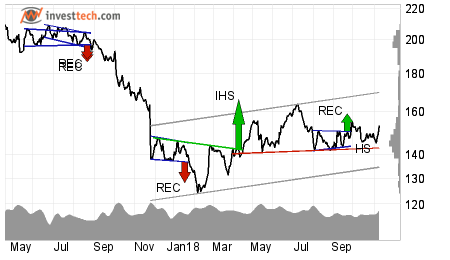
Centrica Plc is inside a rising trend channel on the medium term graph. The stock has taken good support around the 142 area since March this year.
In the graph there is shown this head and shoulders formation under construction. But this formation has little or no meaning at this particular area. Why? As per theory, this formation could be of importance if preceeded by a price rise. This is not the case here. Hence we can overlook it at the moment.
While I write, this stock is up by 0.5 per cent at 9.30 GMT. There is resistance around 164 pounds. A close above that level would be a positive sign and may initiate new buying.
On the downside there is support around 142. A stop-loss can be maintained under that level if the price closes below it.
The stock's monthly average turnover is for over 3000 million pounds, while volatility stands a little under 10 per cent.
Investtech's outlook (one to six months): Buy
FRESNILLO PLC (FRES.L) Close: 902.00
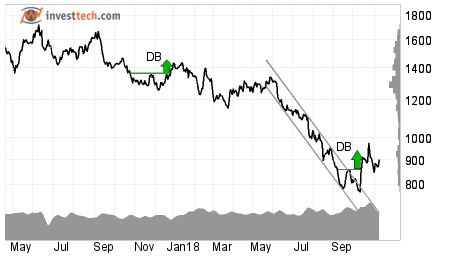
Fresnillo Plc has been chosen as a positive candidate in the medium term and reacted strongly up.
Recently, Fresnillo Plc broke out through the ceiling of the downtrend channel. For the time being, it is difficult to say anything about the future trend direction, but a sequence of rising tops and bottoms can lead to a change in trend or a new uptrend.
There was initiated a buy signal from a double-bottom formation…