I hope everyone had a great Christmas and managed to get a welcome break from the cut and thrust of financial markets. This week I am going to take a look back at the value screens I have developed this year.
But before I dive into that, my holiday reading included the following study by Robeco, which contained some interesting charts that backed up the arguments I made in my recent article, A look back on 2022 through a value investing lens, and I thought it worth sharing those:
Assertion 1 – Value has a long way to run, particularly in small and mid-caps
Using the Value Rank, I showed the supposed rotation to Value seen so far has only really been seen in large caps in certain industries. Looking at global equity markets and using their own measure of “enhanced Value factor”, Robeco find that value stocks remain very cheap relative to history:
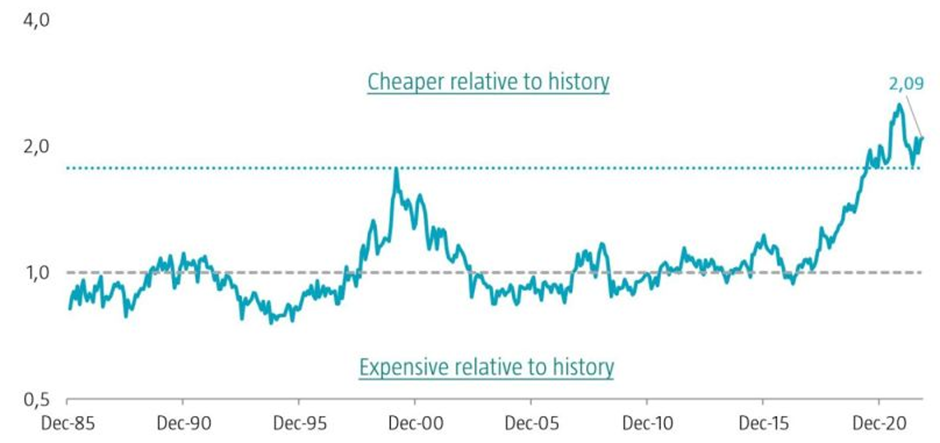
If history is any guide, this is the start of a return to Value, not the end, and the underperforming small and mid-caps are likely to catch up.
Assertion 2 – Value isn’t just a rising interest rate play
Here Robeco plot the monthly returns to their Value factor versus the change in long-term interest rates:
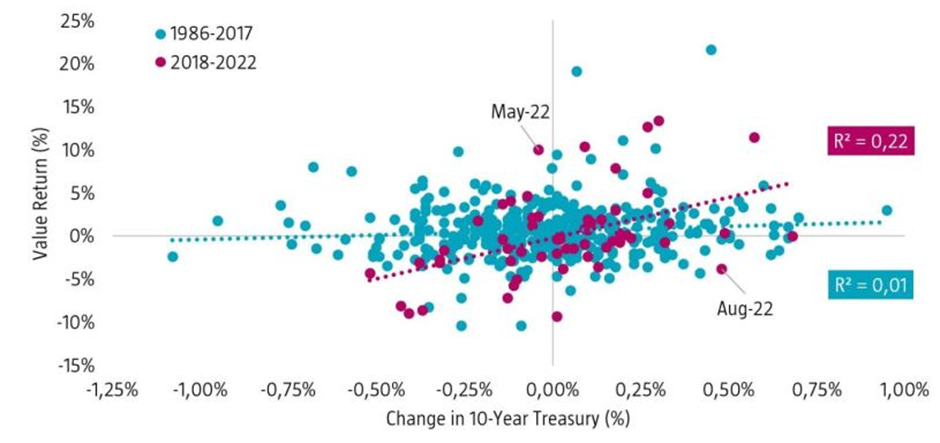
Although there has been a weak correlation over the last five years, the correlation is close to zero over the long term. This backs up my theory that this supposed link is a recent narrative that has been added afterwards to justify a bubble in unprofitable tech stocks rather than a permanent feature of equity markets.
The Guru Screens
The performance of the Stockopedia Value Investing Guru Screens backs up this as not being a great year for Value, whatever the headlines. The YTD performance here ranges from -7% to -52%, despite many of these having Super Stock or Contrarian style designation. Many of these screens only have a small number of hits, making this comparison moot. However, even a screen such as the Benjamin Graham Deep Value Checklist, which has 50 stocks, is down 22% YTD:
The performance of this particular screen was hampered by a…