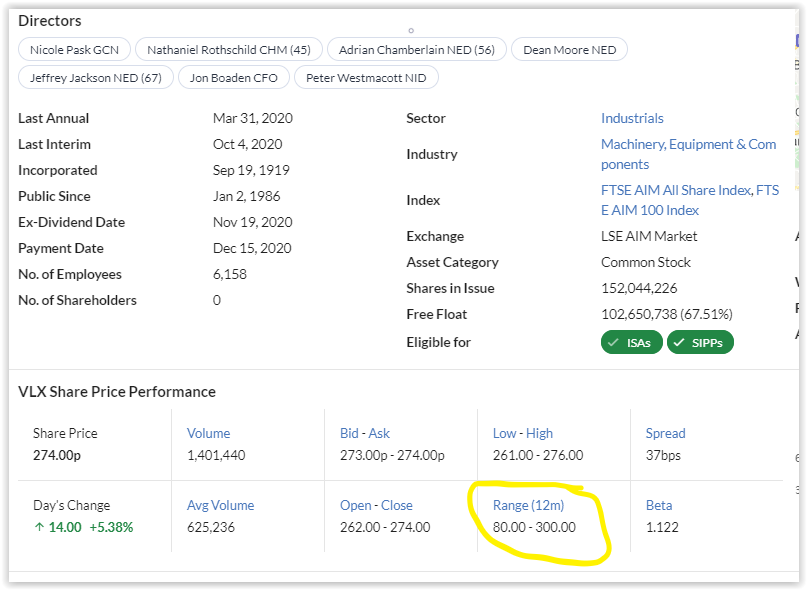
I can't find the 52w high and low prices on the stock report.
I can see a rating based on current price as a % of the 52w high but nothing based on the 52w low price.
Two stocks could be 25% below their 52 week high. But the 52 week low prices might be 30% and 60% respectively below the 52 week highs. This has totally different ramifications for the two stocks.
Surely there is something missing here.
Have contacted stockopedia help for a response. Only just joined and am puzzled by this 'omission'.
Welcome any comments.
Thanks