I've written elsewhere about the obvious limitations of TA applied to individual stocks
http://www.stockopedia.com/content/technical-analysis-on-display-51278/
but I've been a fan for years of macro charts - using them in part to bail out of commodity equities to a greater or lesser extent in 2008 and this year in May.
(Not that that has stopped me buying commodity stocks over the past 6 months ,it just means I've been more picky - recently I've been buying VPP, AFF, SIA and PCI all of which look very cheap on fundamentals.)
I still have a large (40% at the moment ) wodge of cash to think about investing.
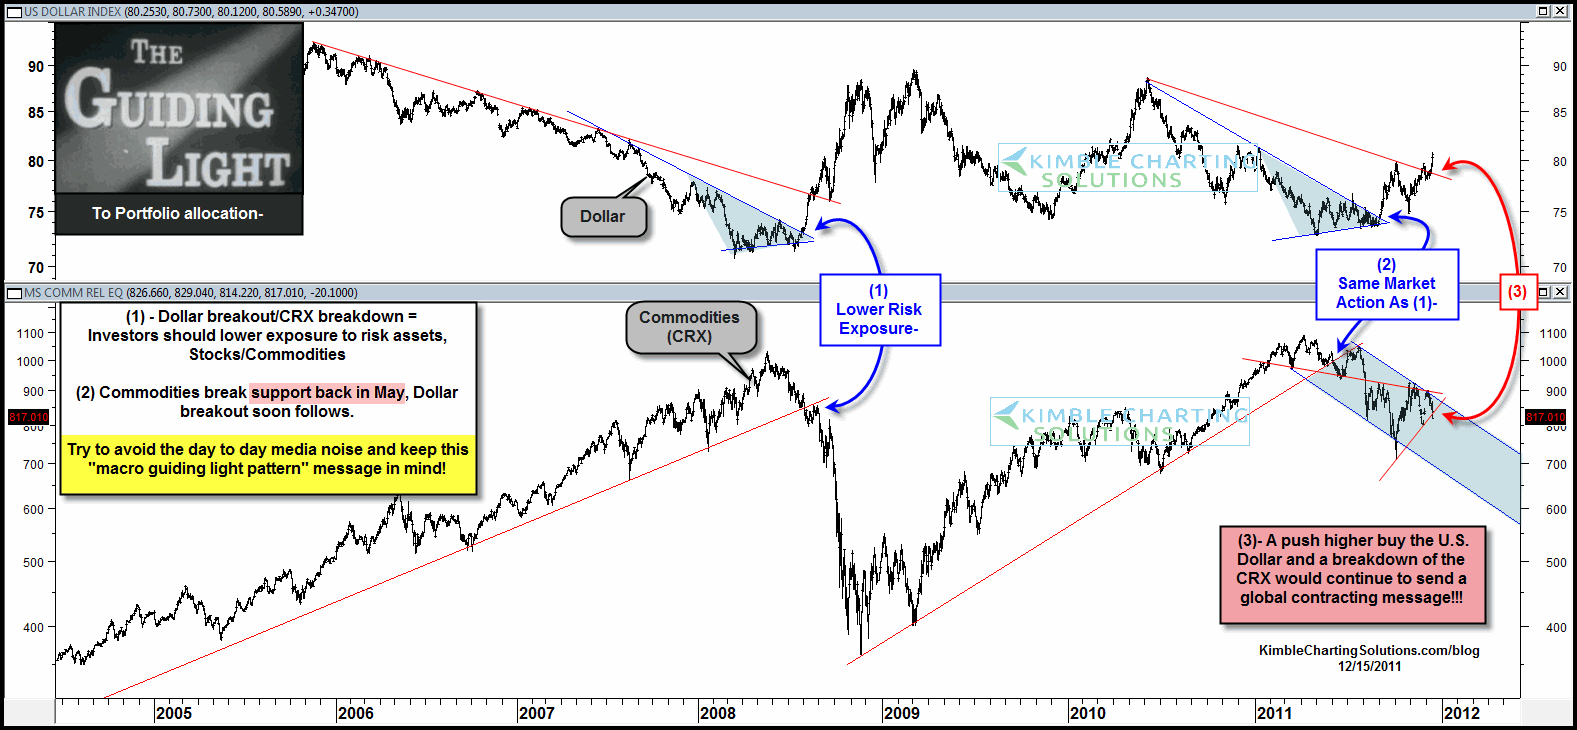
Anyway came across this one tonight and thought it worth repeating here (Sorry about the the inset self serving commentary - I think the charts tell the story)
Couple of thoughts
1.On the face of it it looks like the CRX index might have another 20% to fall in the New Year unless it can break out of its blue trend channel . 2012 looks so deflationary at he mo I'm not inclined to dismiss this.
2.When you see just how much the dollar has recovered you wonder why Gold still atrracts advocates as a store of value -It got trashed in 2008 post Lehmanns -why not again if the Eurozone comes under further pressure.


.gif)


