These are just some musings looking at the performance of the Stocko factors (Q V M) and how their performance changes over time.
When you look at the Stocko performance graph for Momentum Rank (Mkt Cap > £100M, quarterly rebalanced) it looks something like this:
Momentum Rank Quintiles (linear scale)
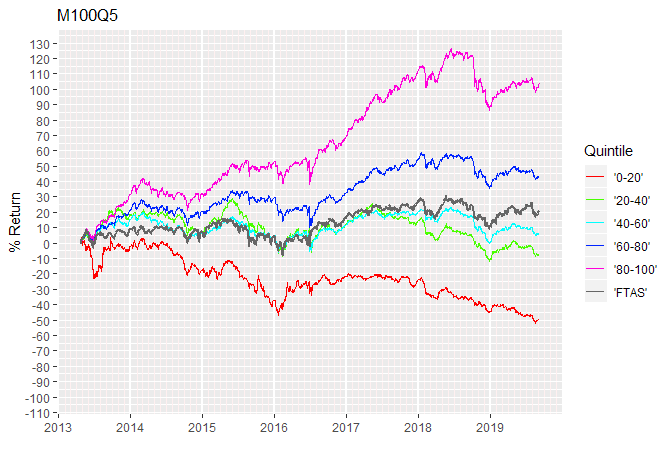
The top quintile is racing upwards and the other quintiles are lined up below, with the bottom quintile heading downwards.
However this gives a rather distorted picture. Once a quintile is above its peers then an increase by some fixed percentage will look better for the higher quintile than the same percentage increase for a lower quintile because the percentage gain is building on a higher base.
We can correct for this visual distortion by using a log scale for the graph. With a log scale the same percentage change results in the same amount of vertical movement regardless of previous performance.
Momentum Rank Quintiles (log scale)
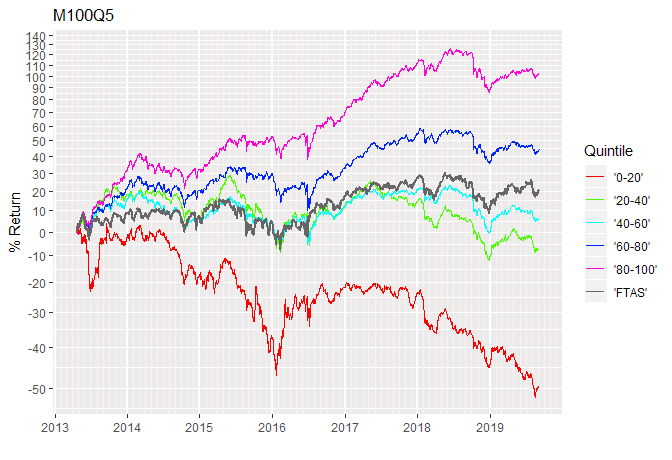
It is much easier on this plot to compare the relative performance of a set of quintiles. Simply compare the slope of each quintile to see which is performing better at any given point in time.
For example look how much more similar the performance in 2017 seems to be across the upper quintiles using the log plot. You can also see that the bottom (red) quintile is actually performing very strongly in 2016 using the log plot; something that is harder to see in the linear plot.
But why visually compare slopes when we have a computer? I can instead compute the slopes and plot that. In practice what I have computed is the return over the previous year on a rolling basis. This is where we go next.
Momentum Rank Quintiles (Rolling 12-month Return)
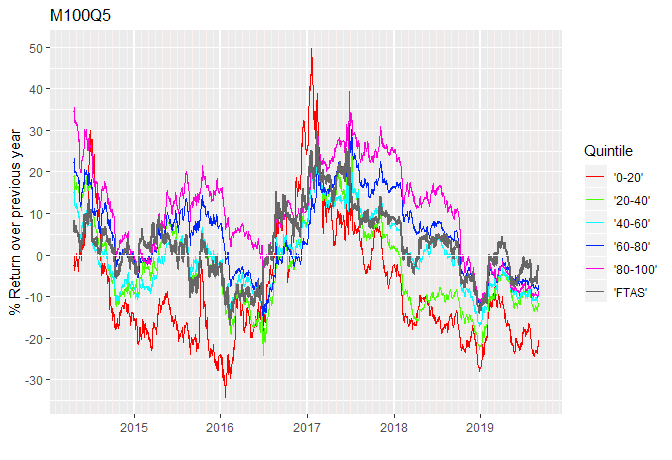
Here is a plot of rolling twelve month returns for the quintiles of Momentum Rank.
It is rather cluttered. Over any given year the performance difference between the quintiles is not very great so the various lines tend to overlap. During the last half of 2016 it is clear that there is not a lot to choose between any of the quintiles. Clearly there are times when no quintile performs significantly differently from the index.
To make things a bit easier to see, let's look at just the top quintile…