Introduction
There have been a few comments about how well (or how badly) the various stock ranks work in practice. So this post looks at their performance and makes some observations about how to get the best from them in the conclusions.
[Caveat - the data in this post is based on stocks with a market cap greater than £75m and values from 2016 to the present.]
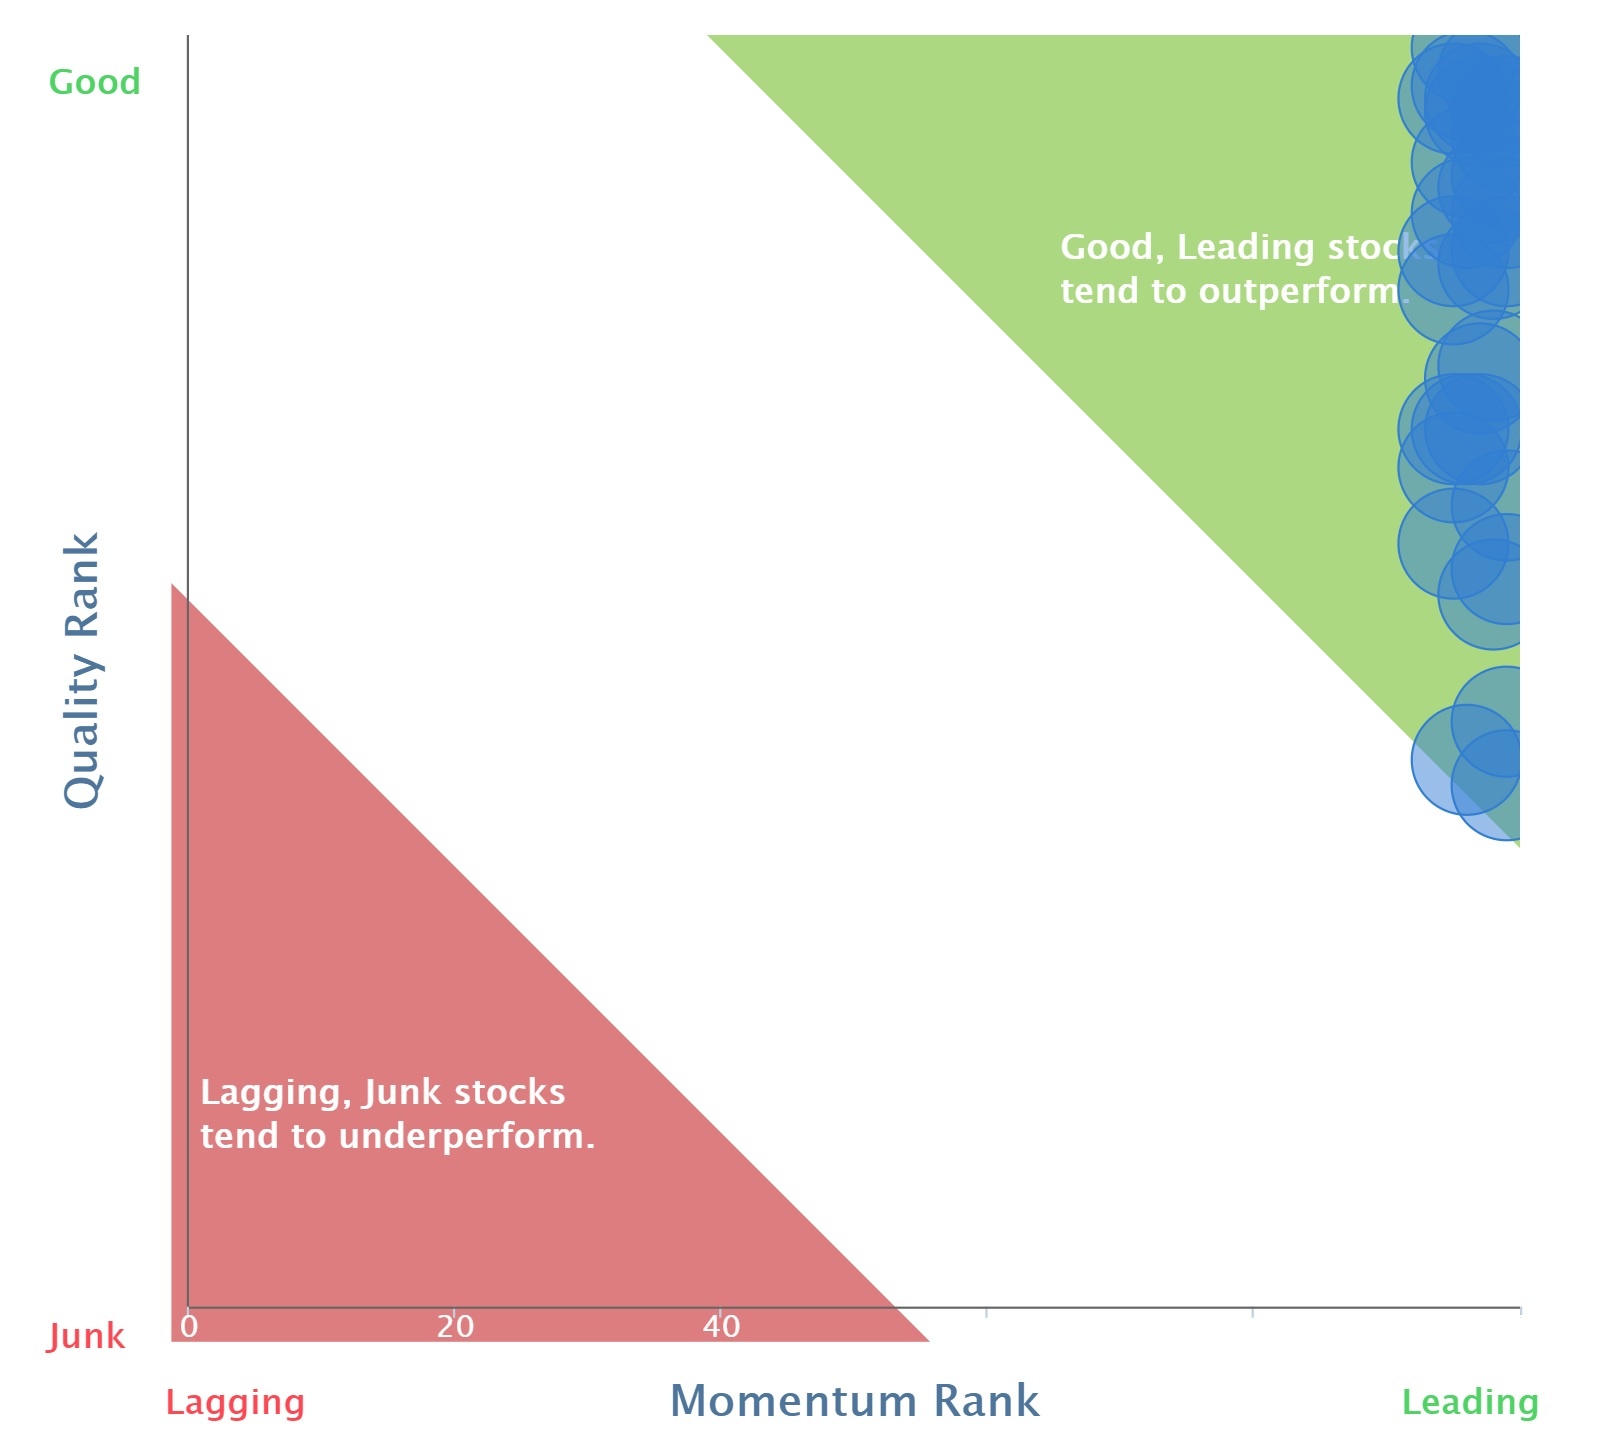
The basic premise behind the Quality Rank, Value Rank and Momentum Rank is that the bigger the rank the better. But what does "better" mean and is it even true that bigger means better? Here are some guidelines on how to use these metrics depending on your risk appetite.
First question though: what is a "rank"? In statistics, a rank is just the position of a value when all the values in the data set are sorted. If this position is converted into a percentage position along the sort it is called a percentile rank which is what each of the Stockopedia Ranks are.
Each of Q V M is a ranked average of a set of ranked metrics. The numbers are determined by a mathematical formula with no subjective aspect (after the initial decision about which metrics to combine.) So we can ignore any human-implied meaning from their very suggestive names and dispassionately look at what they can tell us about capital returns for the following year.
We will ask the question: what is the probability that a given Q V M value (in range 0-100) will result in a yearly return greater than some target? (which we will also express as a percentile rank of possible yearly returns.)
50% quantile yearly returns
Let's start with the simple case of the 50% percentile. So we are asking for the probability that we can get a return better than the median. Approximately: can we "beat" the market (assuming the market return is close to the median return)?
Here are the results for each of Q V M expressed as a likelihood ratio. Without going into detail, the bigger the likelihood ratio the better, and values above 1 indicate doing better than chance (picking stocks at random). The '1' line is drawn in grey on all the plots for ease of reading.
[There is a technical issue here. When you compare the likelihood ratios for say…