When I wrote about Robert Walters in January it was clear to me that this was a solid business that had navigated a number of economic downturns. Which is not to say it's immune to profits collapsing when companies stop hiring but with the eponymous founder still at the reins the firm has prospered for almost 35 years. Previously I speculated that the shares offered decent value and looked set to prosper if macroeconomic concerns eased. Sadly global tensions have, if anything, ratcheted up as demonstrations in Hong Kong add onto Brexit, US-China trade wars and general industrial malaise to dampen optimism. In this light I suppose it's positive that the shares have only fallen 11% during 2019.
The motivation for this post is that Robert Walters put out a Q3 trading update just a few weeks ago and this helped extend a sharp 20% correction in the share price before the recent partial rebound. The catalyst for the de-rating seems to be this key sentence: "Full year profit before tax now expected to be in line with the prior year". Given that analysts had been predicting high single-digit growth up until this point, on the back of solid trading in H1, this warning came as a nasty surprise. In addition the first three quarters of 2019 have produced decent results with Net Fee Income (NFI) up 9% and PBT up 2% in H1 - the latter showing lower growth due to higher finance costs (which I think are down to bringing leaseholds into the accounts as part of IFRS 16). What I want to understand is just how much does the board expect trading to deteriorate in Q4 if it's going to reverse all of the preceding growth?
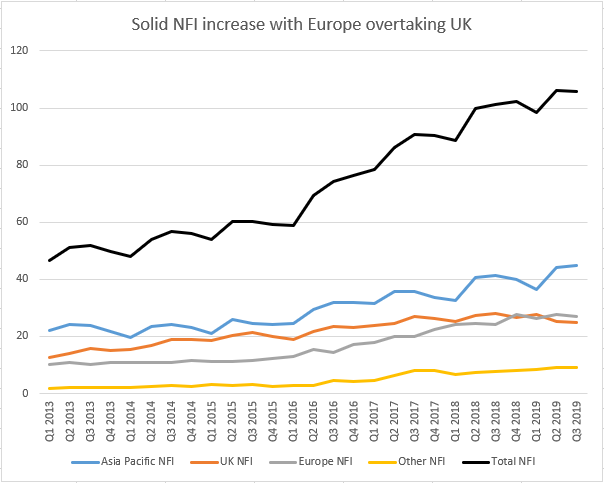
Helpfully Robert Walters provide quarterly updates that specify the NFI (same as gross profit) earned in that period by region. I've collected almost seven years of these updates and it's clear, if you chart just the raw figures, that the group has more than doubled NFI over this period. The largest contribution has consistently come from the Asia Pacific region with Europe overtaking the UK as the latter has gone precisely nowhere since the Brexit referendum:
However this aggregation obscures the actual quarterly changes in growth in different regions. If, instead, you graph year-on-year growth for each quarter then…