Alternatives to UK buy-to-let: Grainger and Daejan

The Conservative government has introduced tax changes that have made UK buy-to-let investment less attractive. Further moves are likely given the pressure from voters that are trying to get onto the housing ladder. It is therefore worth considering listed alternatives to buy-to-let such as Granger and Daejan.
UK residential property has been a fantastic investment over the last couple of decades. This is particularly the case in high demand and supply-constrained cities that have attracted international buyers.
A flat in a city like London is part of a monopoly because there is a limited amount of land in the city centre. The UK is itself land constrained and as such residential property has been resilient and generated strong long-term returns.
This backdrop has encouraged investors to turn towards buy-to-let property and away from equities. The shift is understandable given that the FTSE 100 is currently trading below the level it reached back in 2000.
An attraction of buy-to-let is that it solves the “principal agent” problem because investors can control the asset themselves. Buy-to-let is also one of the only areas that an individual can obtain significant debt finance.
However, buy-to-let investment can mean a lack of diversification and high transaction costs. For a highly mortgaged property there is also the risk of negative equity and investors must be mindful of the obligations to tenants.
In terms of the financial side and rental yields have fallen, due to strong house price gains, and UK interest rates are likely to rise soon. The recent tax changes may therefore tip the balance away from buy-to-let investment.
Against this backdrop it is worth evaluating the listed alternatives to buy-to-let investment. Stock market listed vehicles are certainly less hassle to own and can be bought and sold more easily.
Grainger: The UK’s largest listed specialist landlord
Grainger describes itself as the UK’s largest listed specialist residential landlord and has a market value of around £1bn.Two-thirds of the group’s real estate portfolio by value is made up of UK residential property.
The company is set to increase this focus when the sale of its German real estate assets completes.Grainger is also increasing its emphasis on the private rented sector (PRS) and developing a number of build-to-rent schemes.
Looking at Grainger’s wholly owned real estate and at September 2015 the proportion in reversionary property, by market value, was 72%.Market rented assets were 24% with the remaining 4% was in development assets.
Reversionary assets are where there is a secured tenancy with the rent below the current market level.These properties revert to the full control of Grainger when the tenant departs, and are worth more when vacant.
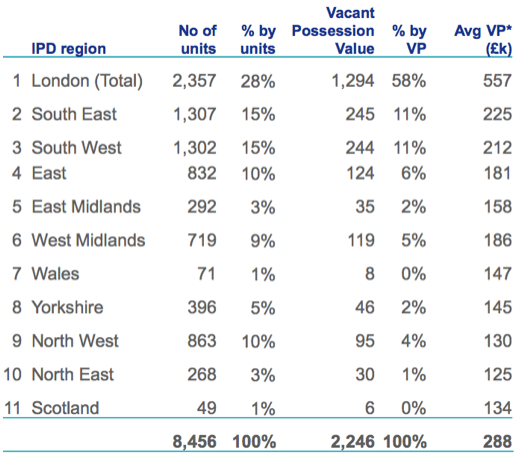
Grainger is geographically diversified across the UK but London is dominant at 58% of the total portfolio (by vacant possession value).This means that Grainger is exposed to the capital’s supply constrained and high demand market.
Grainger UK wholly owned exposure at September 2015
Source: Grainger investor presentation
Looking by average value (vacant possession) and Grainger’s portfolio is certainly not comprised of luxury flats.The group’s average London flat value was £555k which is modest against the price of flats in prime central London locations.
In the South East the average value was £225k, in the South West it was £212k and in the North West it was only £130k.For Grainger’s portfolio as a whole the average flat value at September 2015 was a modest £288k.
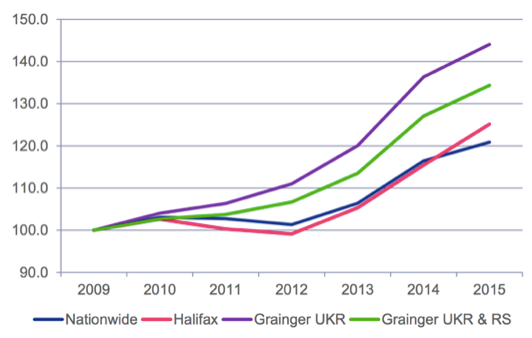
In terms of the valuation momentum and Grainger’s residential assets have outperformed the UK property market since 2009.This reflects the ability to add value when reversionary property becomes vacant.
Grainger’s UK assets have outperformed
Source: Grainger investor presentation
Grainger’s shift into the private rented sector will help to increase the dividend payment over time.In the year to September 2015 the payout was increased by 10% to 2.75p giving an historic yield of only 1.1%.
In terms of the valuation and the triple net asset value rose 8.8% in the year to September 2015 to 263p – an 8% discount to the share price of 243p.The triple net asset value uses the vacant possession value and nets off capital gains tax.
Looking at the balance sheet and the recent pro-forma consolidated loan to value ratio was 44.5% (after recent asset sales).The cost of debt fell to 4.6% in fiscal 2015 versus 5.4% in 2016 and should have scope to fall further back.
Daejan: Over half assets in residential property
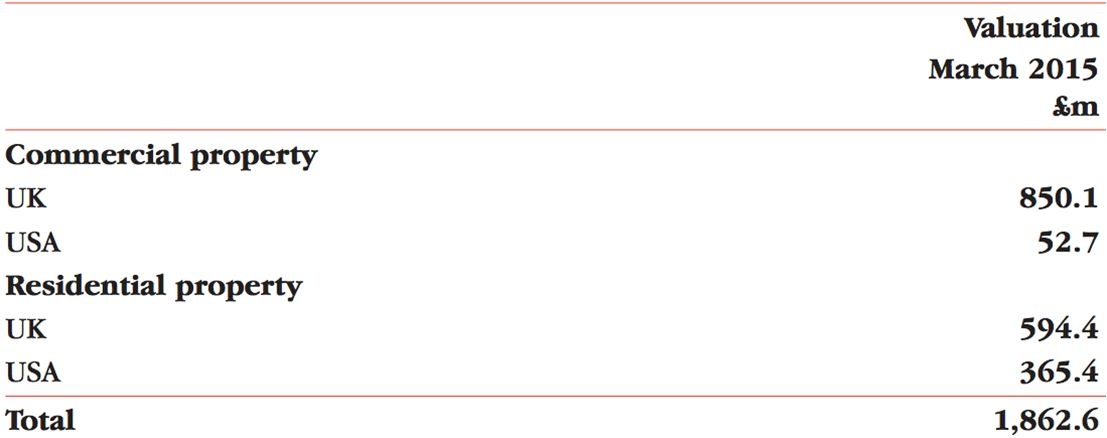
Turning to Daejan Holdings and 51.5% of its £1.862bn real estate portfolio was in residential property at March 2015. This is unusual for a real estate group as the main focus is usually on commercial property.
At March 2015 Daejan had £594.4m of assets in UK residential property and £364.4m in US residential property. The remaining assets were in commercial property with an emphasis on UK offices and UK retail premises.
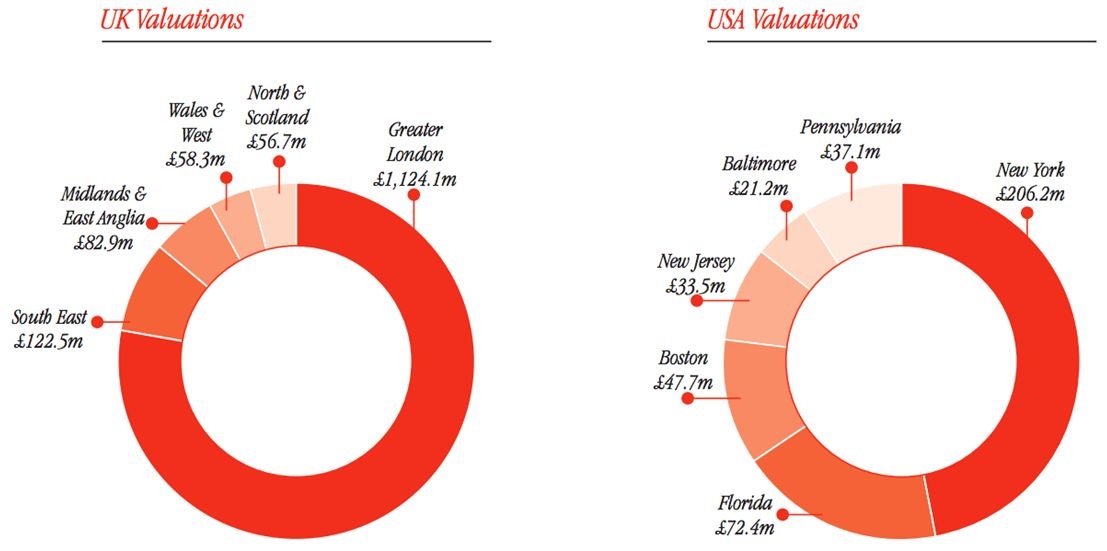
Daejan had 22.4% of the total real estate valuation in the USA at March 2015 with the remainder in the UK. Looking in more detail and 60% of the real estate portfolio was in Greater London and 11% was in New York.
This means that 71% of Daejan’s valuation at March 2015 is in two diversified global cities where real estate demand exceeds supply. This should help ensure that Daejan is resilient and offers the scope for long-term capital gains.
Daejan’s asset base at March 2015
Daejan portfolio by location at March 2015
Source: Daejan Holdings annual report
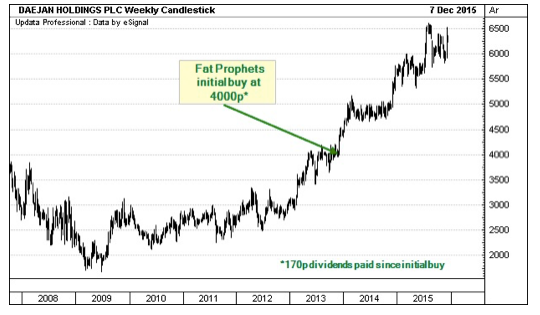
In the year to March 2015 Daejan saw its net asset value per share increase to £81.84 from £68.15 at March 2014. The most recent update has seen the NAV increase to £85.17 at September 2015 versus the current share price at £63.
Daejan Holdings has a low risk balance sheet with borrowings at 16.4% of assets March 2015. The UK gearing ratio was very low at 8.3% and in the USA each property is separately financed on a ring-fenced basis.
Daejan’s historic dividend yield for the year to March 2015 is modest at 1.4% with the group reinvesting profits. However, the dividend payment has grown from 42p in fiscal 1998 to 88p for the year to March 2015.
Summary
The glory days of direct buy-to-let investment in the UK may be coming to an end after two exceptional decades. This is due to tax changes, a slowing market and a political shift to support owner-occupiers.
Listed companies may now offer an easier way to obtain exposure to residential property. This is still an area that should perform well given the growth of the UK population and planning constraints for new build properties.
Both Grainger and Daejan Holdings offer potential alternatives to direct buy-to-let investment. The companies trade at a discount to their net asset value despite having seen recent valuation momentum.
Grainger is currently focused on reversionary property but is increasingly moving into the the private rental sector. The company is also exiting Germany and has the majority of its wholly owned properties, by value, in London.
Daejan Holdings is also focused on London with 60% of its portfolio value located in the capital. Just over half of the group’s assets are in residential property with the remainder in commercial property.
Both companies are worth around £1bn and have well diversified real estate portfolios. We would caution, though, that Daejan is illiquid given that family interests own the majority of the shares.
This report was produced by Fat Prophets Senior Analyst, Andrew Latto.
Disclaimer
This is not financial advice. Our content is intended to be used and must be used for information and education purposes only. Please read our disclaimer and terms and conditions to understand our obligations.
6 comments
whitbyview - a good question. Grainger I think is a bit difficult due to the reversionary property. So the book value of this maybe with tenants. However, when it becomes vacant it becomes more valuable and this is the value that Grainger calculates its NNNAV from. The difference between Gross and Net Net asset value is that the latter factors in taxes in any sales of assets (capital gains). Grainger does sell reversionary property when it becomes vacant. So the NNNAV (triple net asset value) seems like the best figure to go for. I haven't tried to tie that up to what the group reports book value in the accounts as.
Thanks very much for the reply, Gus. Reading the other post and messages does indeed help. I guess this is a lesson for me in my new use of Stockopedia ... They can only report what the companies state and if companies use a different standard or benchmark, this is clearly going to skew the figures quoted and the consequent ranks etc. Learnt something today - thank you!
Interesting article - thank you. I wonder if I can ask an incredibly 'stupid question'? If grainger is at a discount to NAV then how can the Stockopedia P/B currently be 1.75? I thought initially this was because the NAV was based on vacant prices but then found Daejan P/B was < 1, so am now just confused! Something seems inconsistent here. Told you it was a silly question but any help gratefully received :)
Hi Whitbyview.
No such thing as a stupid question - just sometimes you might get a dumb answer!
I defer to ratioinvestor who wrote the original article with regard to the specifics on Grainger. As a general comment, to get a better handle on this ratio you need to look into the accounting policies of the underlying company. This is especially key for companies with a significant property or other realisable fixed asset base (such as an investment company's holding of shares). For example, property can often be shown in the accounts at either "cost" or "appraised market value". If a company owns a factory purchased for say £1m 25 years ago this might now be worth many times the original amount, thus the choice of accounting policy might materially understate the real economic position. For the companies in this article which have a large proportion of their assets in tenanted properties purchased many years ago the difference between book and fair market value is very significant and will have a marked impact on ratios such as P/B, P/NAV etc.
If you look at the vegpatch analysis on Mountview Estates (LON:MTVW) referred to in my post above, you will see a good analysis of the point and by extension a good, considered opinion on why the shares are "cheap".
Gus.
Gus 1065 - thanks for that I haven't looked at Mountview Estates closely. A bit more complex, smaller in size and at a premium to its NAV. But I understand the premium is understated. I think a similar model to Grainger as it focuses on reversionary assets as well. I'll have a look.
You could add Mountview Estates (LON:MTVW) to the peer group of corporate players in the sector. A good write up from vegpatch on the 26th November.
Gus.