For UK stocks, I am looking for a website where I can plot the stock price that would be implied by the minimum and median historical Price to Sales ratio over time. The idea here is to be able to visualize the actual stock price against the range a stock could have traded at - on any given date - based on the median and minimum price to sales ratios for the prior 10 years. This helps to see when a cyclical company is trading near its lows based on historical price to sales.
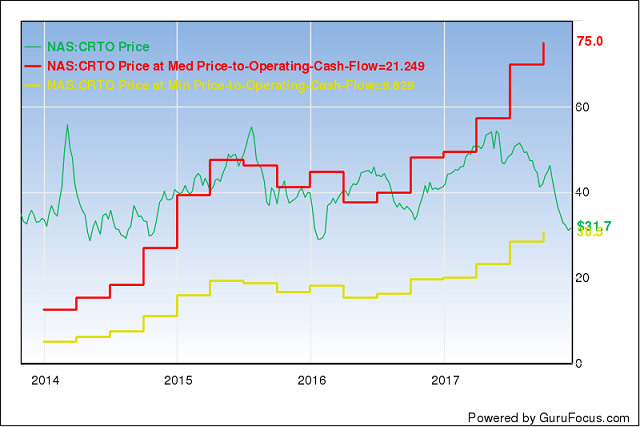
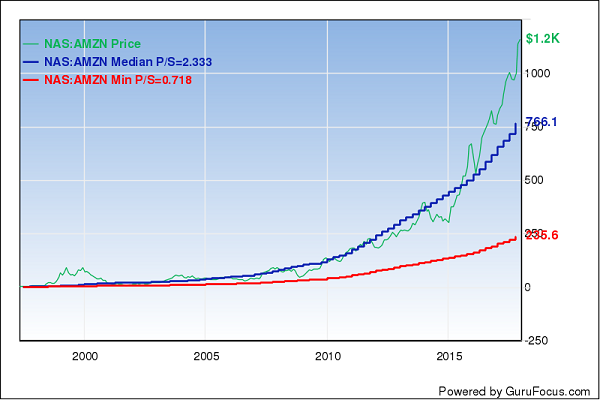
The attached image shows what I get for the US symbol CRTO using the site gurufocus. The green line is the day stock price chart for CRTO. The red line is what the price would have been based on the median price to sales for the last N years. The yellow line is what the price would have been based on the minimum price to sales for the last N years. (By the way, I rejected CRTO for the reason that there is significant speculation that their revenues are potentially fraudulent...so I should not have used them as my example here. See my injection of a similar chart for Amazon in the comments below as a better example.)
I am hoping to find a site that can do this at lower cost than gurufocus can, for UK stocks. Anything out there?