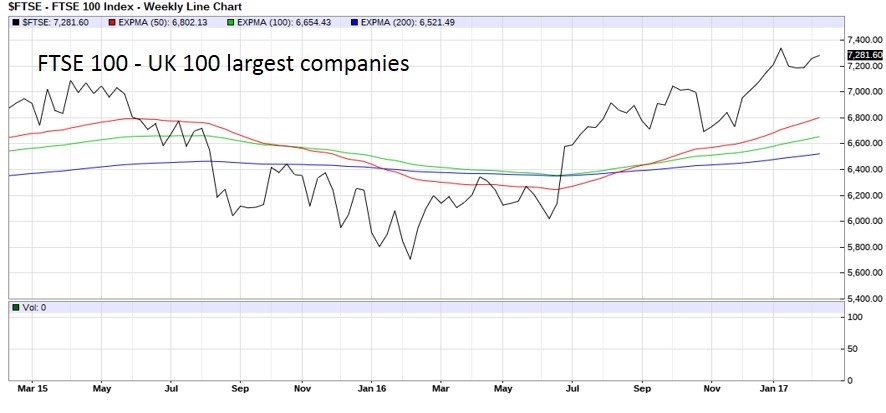
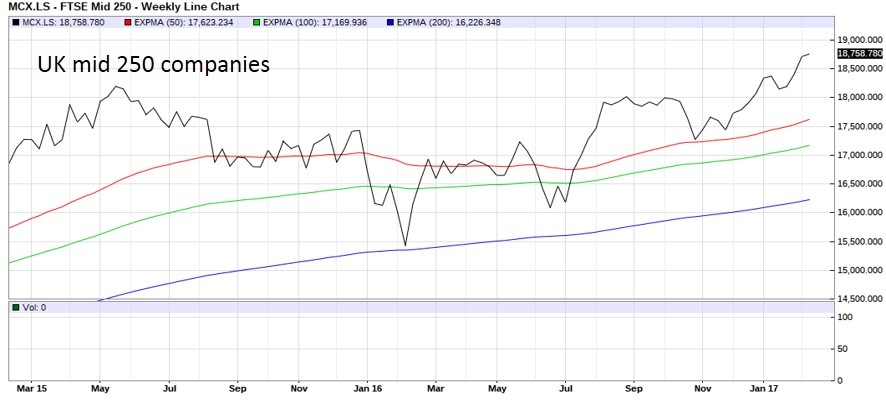
Here is a comparison of all current major US and UK stock indices, tracked against the 50, 100 and 200 EMA s. The time period is the past two years.
So as the headline says, are we living in dangerous times?
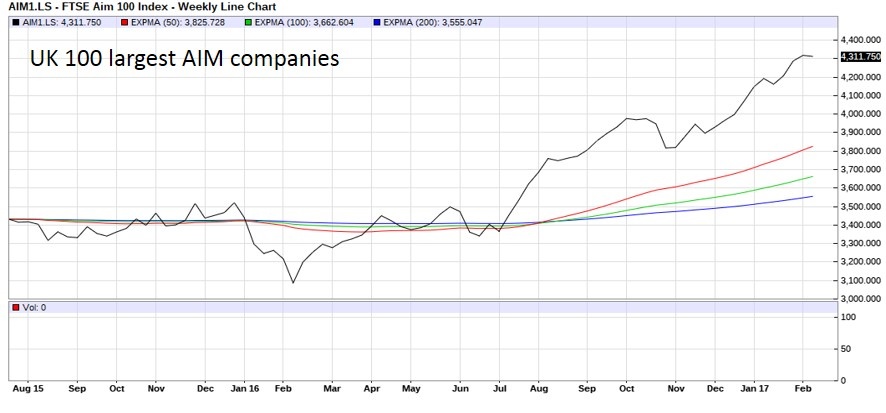
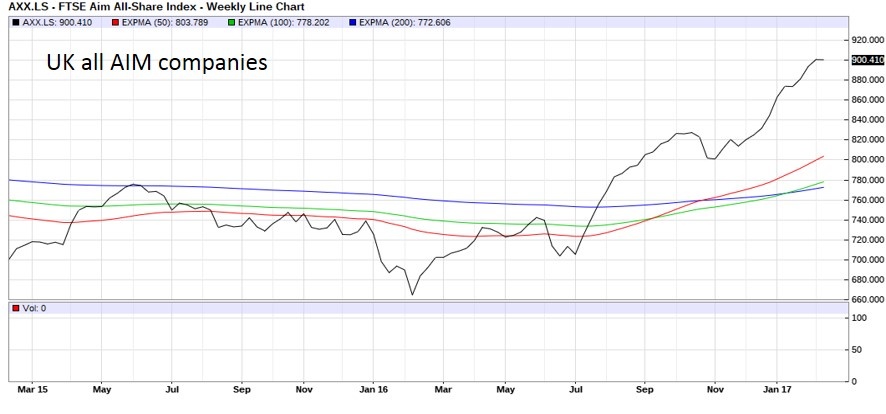
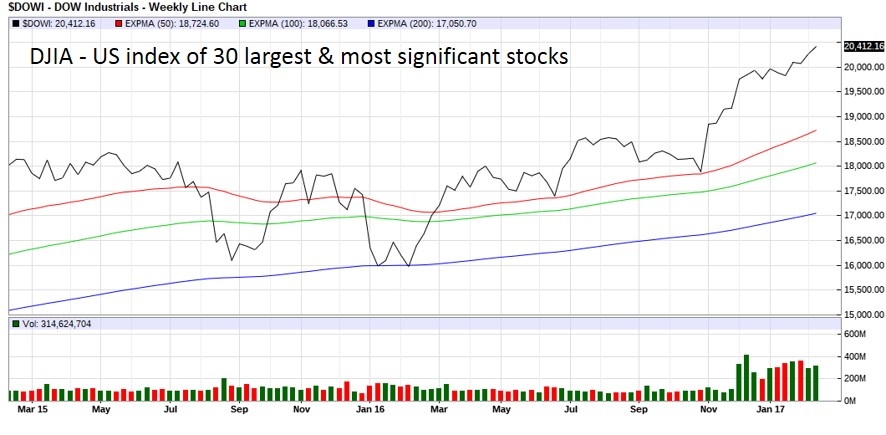
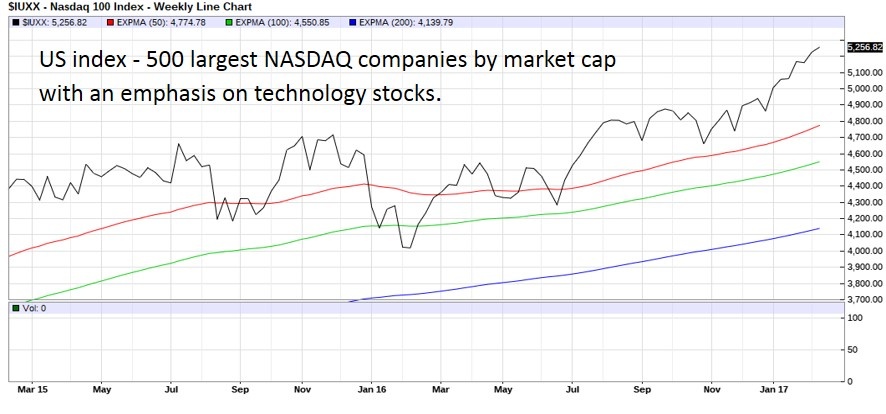
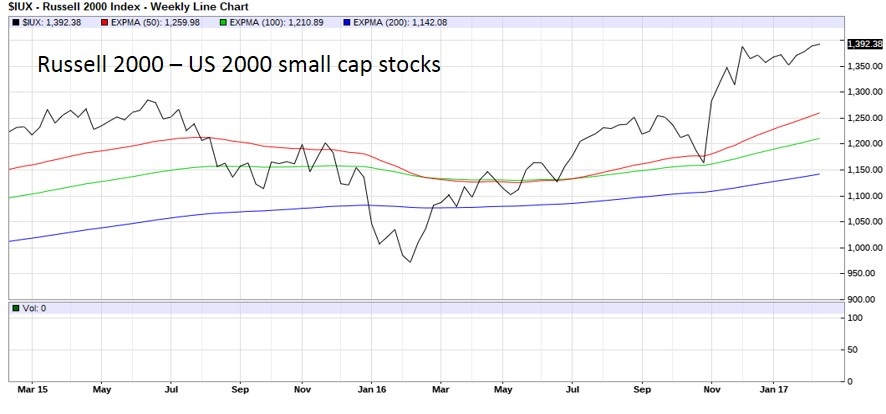
Here is a comparison of all current major US and UK stock indices, tracked against the 50, 100 and 200 EMA s. The time period is the past two years.
So as the headline says, are we living in dangerous times?

I have been doing some research on this to try to make my investing more systematic.
especially considering i'm a small cap momentum investor at 140% leverage.
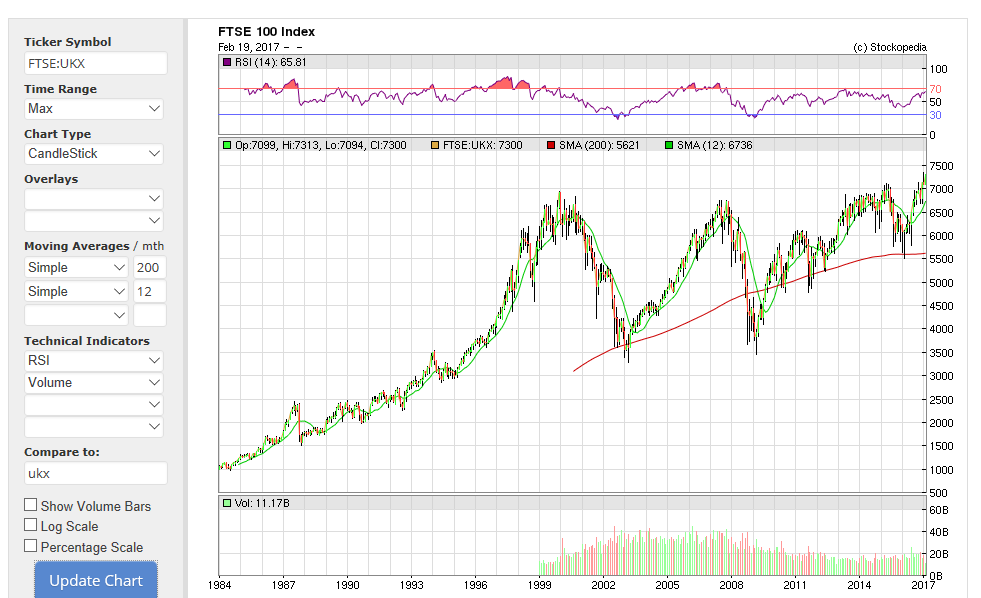
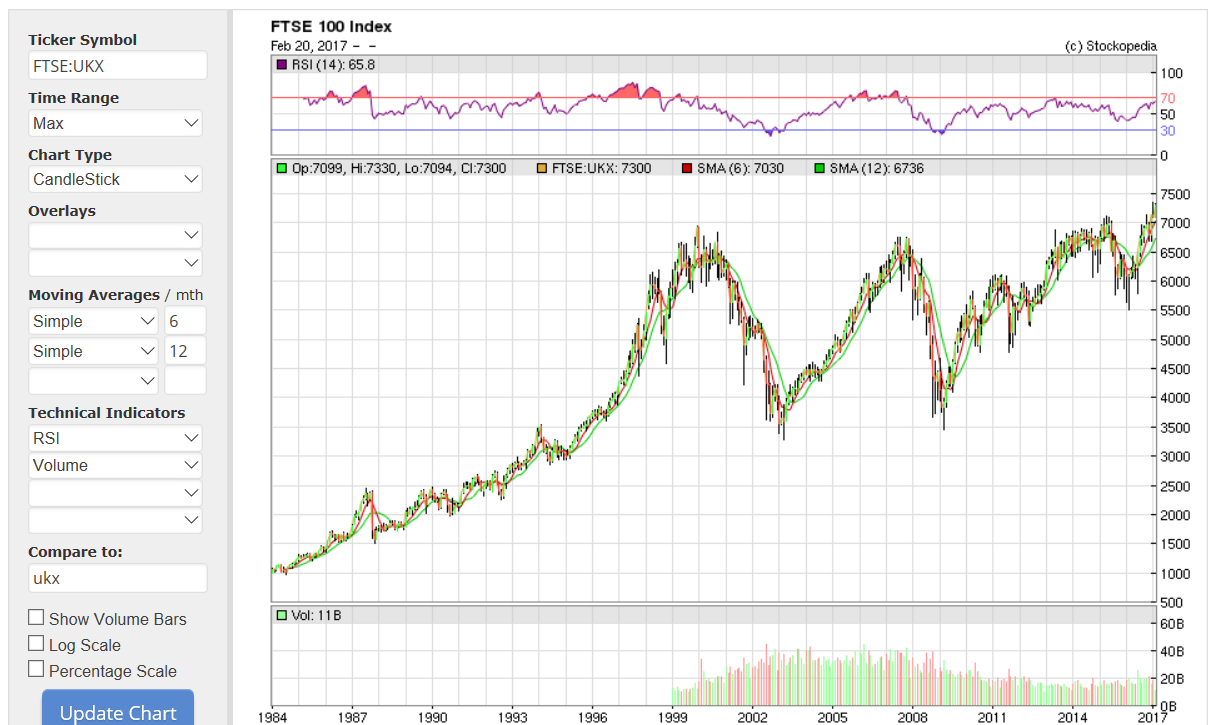
If you adopt a 12 month moving average and sell when the market drops below this level (green Line) and buy above it you would have missed the majority of each down turn, and gained from the majority of the uptrend.
This is something I will adopt to help me sleep at night.
Pleased we are comfortable above the green line at the moment.

I think if you analyse this method on good charts you will find it will be costly especially when markets move sideways which they have a tendency to do a lot of the time. You can back test at least fifty years with Sharescope, not Sharepad as the charts, like Stocko are a bit more difficult to do the analysis on, it is possible if you highlight each area where you think you would have bought /sold. Sorry to be the bearer of bad news it always looks good when someone is trying to prove a point one of my favourite lines " if it was easy we would all be doing it" and if that ever happened no one would make any money.
Hi Ken,
Thanks for the feedback, as much as I agree with "if it was easy we would all be doing it" I cant disagree with the facts. If you adopted a 6SMA and 12SMA (Monthly periods) crossover we would have missed the two largest drops and re entered at close to an optimum moment.
I say "we shouldn't just dismiss ideas just because they seem simple"

This is roughly equivalent to saying buy when FTSE100 is higher now than it was six months ago. It is a simple momentum based indicator with a six month lag.
Absolutely, similar principle to the dual momentum method that has been well credited.
Simple method that has historical accuracy.
you have to take into account all the periods that have gone before and after where the SMA has crossed the line for a couple of days/ months and then moved back again over the line. Also it is easy to know what to do when you can see what happens. The best way to do the analysis is to move forward through the chart on a day by day or in this case month by month basis. You will find that by the time you get to the big moves you will have probably lost most of the money. Like I said look closely at the periods around the moves, a prime example in the chart shown would be the months 1999 /2002 just prior to the major fall. Further more I think you will find the month lags real life and a lot can happen in a month and then the temptation is to go for a shorter period and then you are back to a daily analysis. I would love to be proved wrong, perhaps you can let us know how you are doing over the next two years.
Hi Ken, I appreciate what you are saying and nothing is fool proof, but looking at the above chart starting from 1995 (prior this the chart is to small to determine).
1995-2000 we would have seen approx 90% of upswing.
2000-2003 we would have missed approx 95% of downturn.
2003-2008 we would have seen approx 95% of upswing.
2008-2009 we would have missed 100% of downturn.
2009 onwards approx 80% of upswing.
In terms of returns it would have been astronomical compared to benchmark.
I will certainly follow this metric.
I have also done the work and give or take a few plus/minus points at entry, you are correct. The analysis obviously excludes dealing costs and dividends but strangely enough I also started in 1995 on 28th April entry point 3215 which you would ride until 30/10/98 having gained 2237 pts. assuming you were still invested today you would have had a total of nine trades six winning and three losing, The biggest gain would have been the first trade already mentioned and the biggest loss would have been 900 pts 23/4/15 - 28/08/15. Had you remained invested throughout in a tracker you would have 4100pts gain as apposed to an overall gain of 4308 in the "method". However if you had started 26/2/99 you would have had eight trades five winning three negative the biggest gain would have been 1711 pts and biggest loss 900pts as stated earlier you would still be in the market entered on 29/07/16 and with a profit of 800 pts this leg-- your overall profit would be 2064 pts but if it had been an index tracker you would have been invested at all times and only have a gain of 1100pts. I am not sure your percentages are right as you would have exited the market prior to 2000 and had nine entry points and eight exit. Obviously my charts show entry and exit points which are possible too small for the Stocko chart. Also I am using a monthly index to try and get my entry and exit as close as possible. I hope you accept my word for it as I cant see anything to be gained by fudging the figures--- the main point is it works over time but if you pick your entry point at the wrong time you could have substantial losses or less gains I will check the figures in detail but it won't be for a couple of days.
Hi gpacker
PLEASE IGNORE MY PREVIOUS POST.
You are quite correct it works-- I back tested from the entry point on November 1996 to the present day on the following rules:-
Rules Time Period Daily ---SMA 12 months SMA 6 months
Trade at the opening price the day following a clear break.
DATE IN OUT GAIN LOSS NET
11/07/95 3447
23/02/01 6003 2556 2556
14/11/02 4380
11/03/08 5655 1275 3831
03/12/09 5361
02/12/11 5489 128 3959
16/08/12 5833
19/03/15 6945 1112 5071
06/05/15 6927
09/11/15 6353 574 4437
19/10/16 7000
Latest Value 7274 total to date 4767.
I also back tested to the months prior to the 1973 crash where 75% was wiped off the market and it would have got you out at FT 584, the high was 680 and the low 180. You would have re-entered at 363 and over the period to July 1995 you would have five new positions, only one of which would be losing, approx. 10%. Overall I calculate you would have a profit of about 1970pts, the actual index rise was 2740 pts. The system obviously removes the tops and bottoms and because of the speed of the October 1987 crash it would not have got you out, in fact it didn’t exit until the recovery was underway in June 1988, but you would still have a smile on your face with a profit for the leg of about 180% .
Sorry I doubted you without testing first. My in built distrust of all formulas kicks in as I have tested many and always found them wanting.
Regards
Ken
Hi Ken,
Thanks for the effort put in here, that's good news and adds some confidence to my research. After your initial thoughts I started to doubt myself :-).
Just to clarify your back test was at the point of crossover?
Any sudden crash such as 1987 is I suspect unavoidable fully but at least gives us some breathing space with such an indicator.
I had a book delivered yesterday I believe its called quantitative momentum investing which covers this system.
Once I have read it I will share with you here their findings also.
Regards
Gary
Just to clarify your back test was at the point of crossover?
Not quite sure I understand the question but I tracked through the chart until the six month crossed the twelve and left clear space. I assumed that in real time it would be the end of the day and I would leave a fill order to get the opening price the following day.
Hope that helps
The interconnectedness of the markets globally may be a help in building better warning systems. The US markets have a more extensive set of breadth indicators that seem to provide additional confirmation on when to quit and when to hold. I haven't backtested extensively, but reducing the position as market breadth reduces (e.g. Russell 2000 vs SP500 falls) looks to be a worthwhile technique.

Markets are certainly going up at the moment, "bull markets climb a wall of worry", etc etc. And the FTSE 100 has banks and commodities that appear to be reasonably early in what could be a long, slow recovery, and Unilever with it's steady market and low leverage. This could go a lot further from here before the next recession (a year or two away?) and markets are generally fairly slow to roll over. I'm holding.
I have to say that at various times over the years as soon as I have felt a bit smug at how well my portfolio is doing something nasty invariably happens and I am soon feeling foolish. I am feeling a little smug at the moment.
On the plus side my portfolio makeup has changed dramatically since I became a Stockopedia devotee so it is full of modest p/e, good yield, strong balance sheet type stocks which means I hope to do better in any correction.
Like everyone else I have no idea what the future holds but Trump, Putin, China, Brexit, Europe makes me very nervous, and that's just the things we do know about!
Agreed, as soon as I discuss with my wife my latest brilliant move, it comes tumbling around my ears. " If you want to make God laugh show him your business plan" ( Ex Burger King Boss )
.JPG)
Never trust a correlation without an underlying causal theory.
I call it the "machine learning fallacy".
Does carrying a cigarette lighter cause cancer?


