Here is a comparison of all current major US and UK stock indices, tracked against the 50, 100 and 200 EMA s. The time period is the past two years.
So as the headline says, are we living in dangerous times?
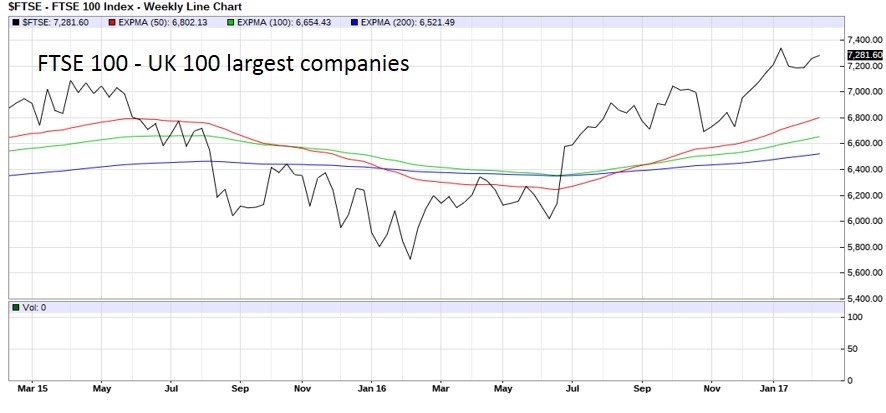
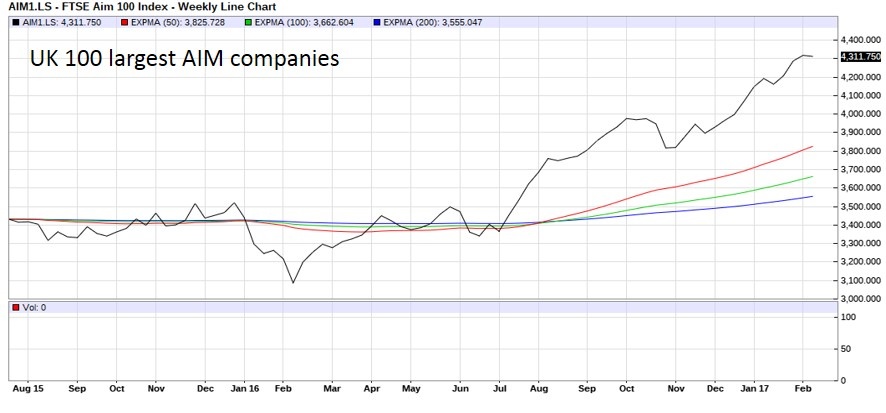
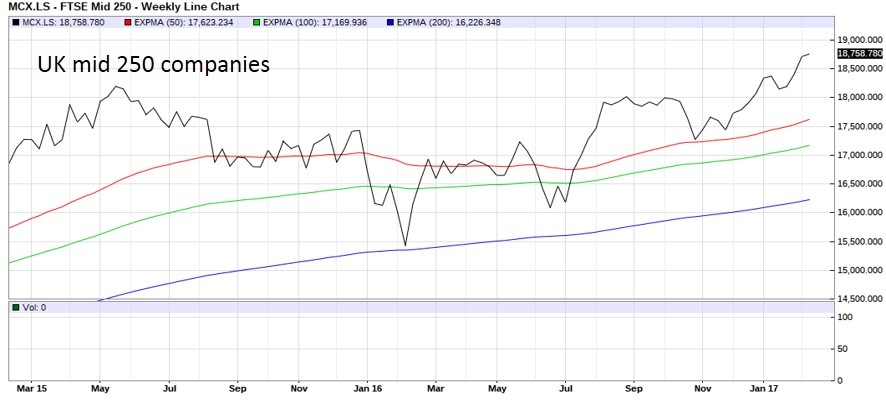
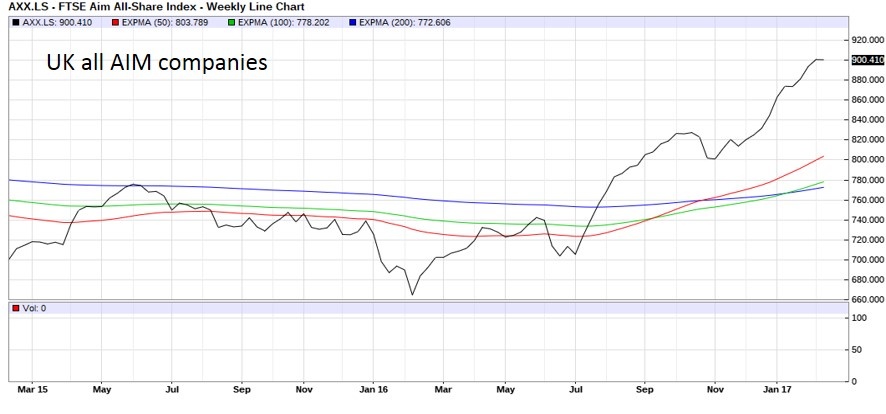
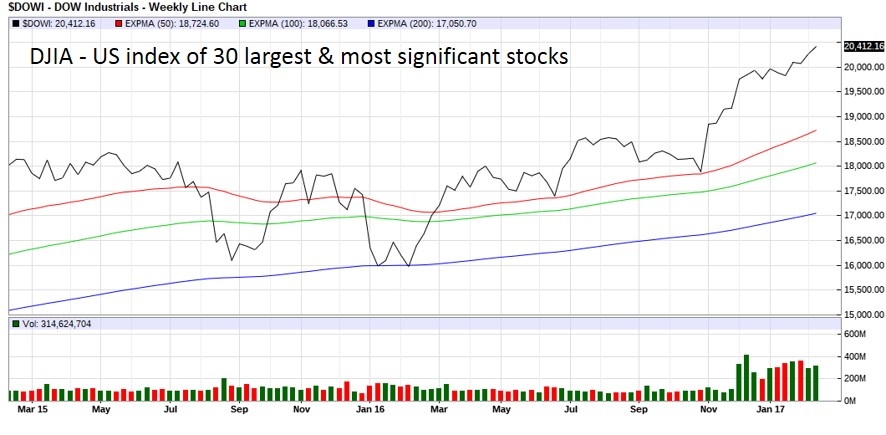
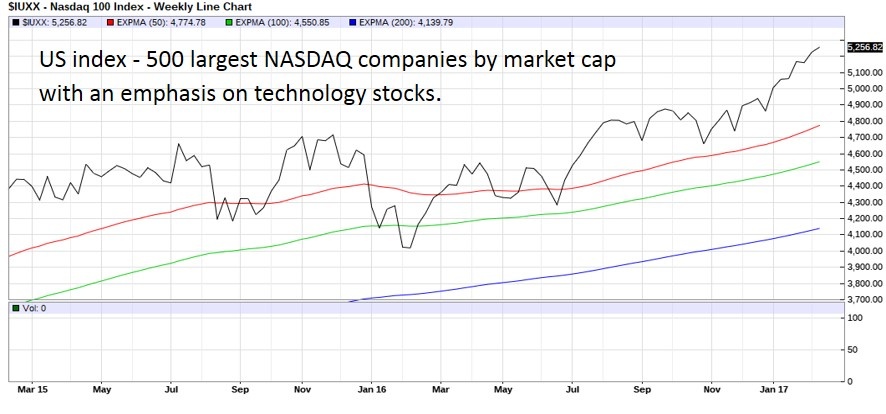
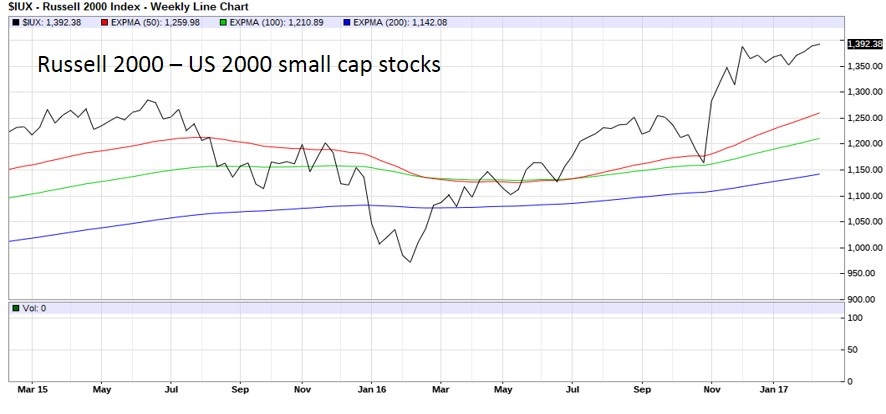
Here is a comparison of all current major US and UK stock indices, tracked against the 50, 100 and 200 EMA s. The time period is the past two years.
So as the headline says, are we living in dangerous times?


I would have thought that from a technical point of view those charts are all very bullish. The price is above the moving averages. The short term moving averages are above the long term. The gradient of everything is pointing upwards. All considered strong buy signals as I understand it.
But yes, I have also been wondering if we are due a correction. Yesterday and today I have sold about 50% of my shares (probably a very bullish indicator) and I shall continue to have a clearout of all but the strongest of my holdings.
Timing the market might be a mugs game, but preserving your capital is not. With the pain of losses being three times greater than the pleasure of profits I think I would rather be on the sidelines at the moment.
Ramridge - would you invest money into an individual share if they had a graph like the one's you posted? I certainly would.
Bliss - would you now only invest back into the market/shares once it dips below the price you sold at?
James,
No, although that would be nice!
I am adopting an early "sell in May" approach. I would be happy to buy back at higher prices if I think the outlook is good. For now I think the spring/summer might be a dangerous time.

We all know that one day there will be a correction or crash, but IMHO trying to time it is a risky game due to the loss of time in the market.
So I've made the decision that I want to remain fully invested without trying to time crashes, but I'd still like surplus capital to invest at the bottom if the market does crash. My solution is to have a CFD account that is linked to my share account (share account provides initial margin, only running losses require cash funding). Currently that is running at really low leverage (about 5% of total portfolio). Should the markets crash then extra leverage is available to take advantage.
The only time I've really used it in anger was in the post-Brexit period, when it came in very useful.
Having said that, there are a lot of large cap companies at the moment that I'd like to buy but are simply too expensive. Regardless of the overall market, I'm still looking for sensible valuations on individual companies.
For what it's worth, my view is that this shows a correction is due soon (defined as no more than a 10% drop), possibly in the first half of this year.
But then this is not any better than a London black cab driver's opinion.
the markets have been up and down like a yo yo the last 2 years. so everyone is assuming a crash or correction is due to some markets being at their peak. but when the graphs are showing that its a buy signal showing positive markets. but everyone wants to believe the opposite.
im fully invested and intend to remain that way. as we also learnt if their is a correction remaining invested most things will recover.
My position is no secret, I have been bearish for some time and will remain so, I have been buying recovery stocks short term oil, mining, gold mines plus a couple of speculative stocks and yesterday I decided to take the profit, but not in gold. I wanted to wait until the new tax year but a lot of the things going on in the world really worry me and markets don't usually flag up the crash, it just sneaks up on the unwary. I am working on the principle that if I am lucky and I can buy back cheaper that will be great, if not there is always another stock to buy, especially with the analysis tools that we have these days and I am not talking technical analysis. If I am not sure I sell and buy back in my Sipp because I would rather lose money there than in my everyday account, if the stock doesn't fall then the profit happening in the Sipp is still welcome.

Those graphs are all very bullish and you have a few comments from people who are expecting the worse and holding cash rather than shares. To me that seems pretty bullish! Times are always dangerous though...
I'm fully invested but avoiding UK cyclicals because of possible Brexit effects (no idea what they might be but seems prudent to avoid).
Bullish.
Also interesting that Brexit barely registers as a blip and that the low was Feb 16 (China).
unless banks crash like in 2007/08 there will be no major correction it will just be seen as a blip.
if anything banks are seen as value stocks at the moment.
It also depends upon how long you want your investments in the market for. If you going to be retiring in the next 2 years, then maybe yes, now is the time to start selling.
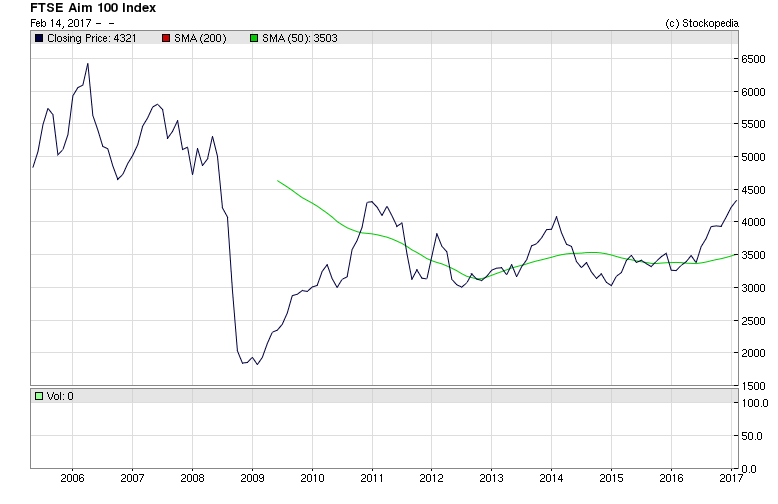
The charts below is are all 10 years + , and in my mind, show that we arent necessarily in a bubble.
The stock market, in a years time, might be lower. But I think a well balanced portfolio, with regular monitoring, trailing stop losses, is the best way to protect capital and not trying to predict future market prices.
F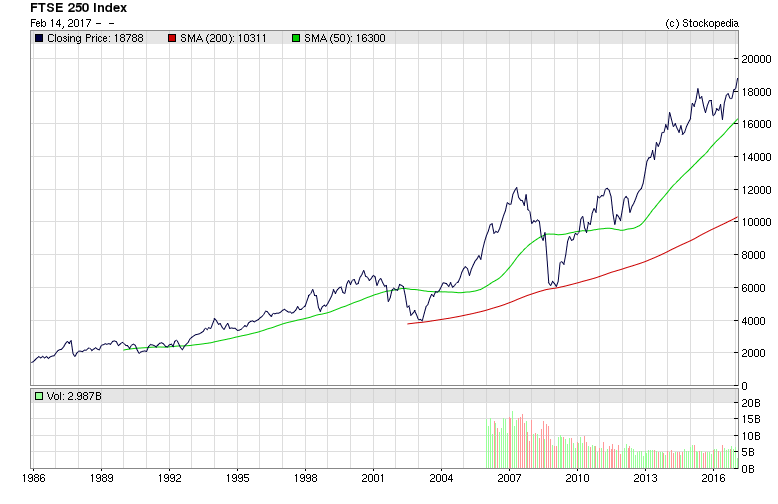
AIM
Without any reference to long term trends or to proper valuation mectrics, what meaningful information can be gleaned from these 2 year graphs ?
Most of it is just noise. Short term & not much happening.
The AIM graphs might just be worthy of some further analysis to establish why they suddenly perked up.
The tone of these comments proves Ramridge's point to my mind.
Most are calm and confident.
Markets only crash downwards.
When that happens, and it will, comments on bulletin boards will express more concern.