Let me first start by defining a trend.
- In an uptrend, price breaks resistance and resistance becomes support.
- In a downtrend, price breaks support and support becomes resistance.
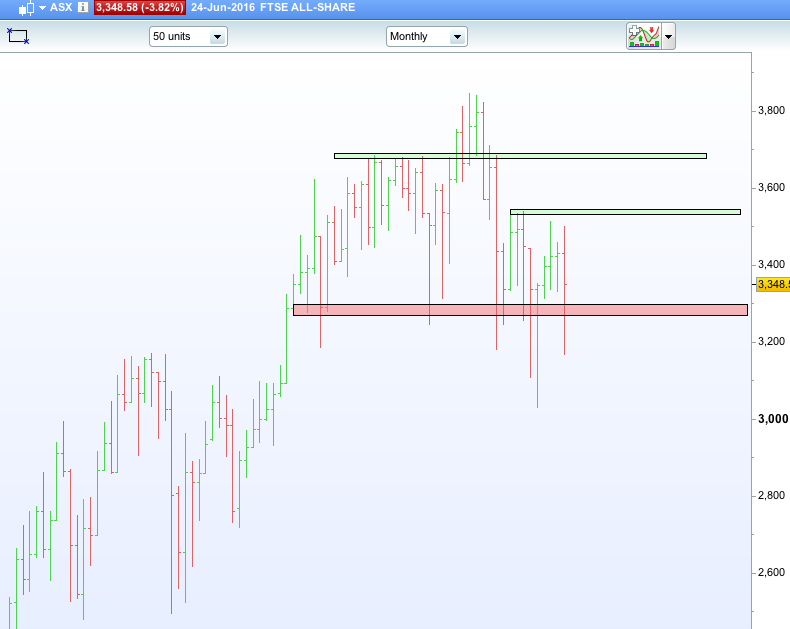
See the attached chart of the FTSE all share.
The highest green line shows the last movement in the uptrend. Price broke resistance and resistance became support. However price proceeded to break below this level as support and it has since held as resistance.
Then take the second green box. This also was acting as support but we broke below it and price now acts as resistance.
The red box is the next area to watch. Once price breaks below that then that's the next area we would expect to continue trading under.
Technical bear markets accompanied by volatility seems like where we could be heading and I will look forward to exercising stop losses where triggered and sitting out until the technical picture reverses.