(Looking at the behaviour of stock fundamentals beyond two sigma.)
Motivation
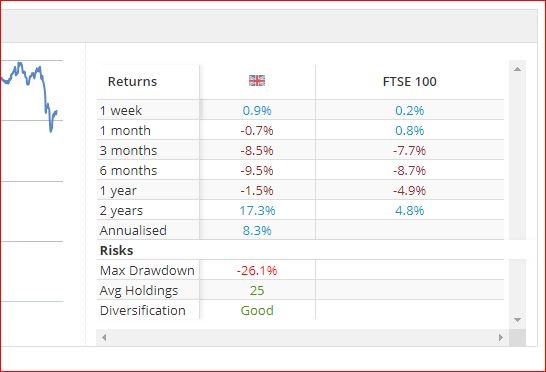
The genesis of this post was watching all the high-QM low-V stocks diving in the recent fall. All the backtest data says that you can't have too much quality or momentum when times are good. But how much is too much when things get a bit tricky?
Some time ago I wrote a post about the fat tails that you see on stock returns and discussed whether you could avoid the worst of the left fat tail.
Here is a quick summary of that post. We start with a histogram of log(stock returns) like this (where the sample data is in the grey blocks):
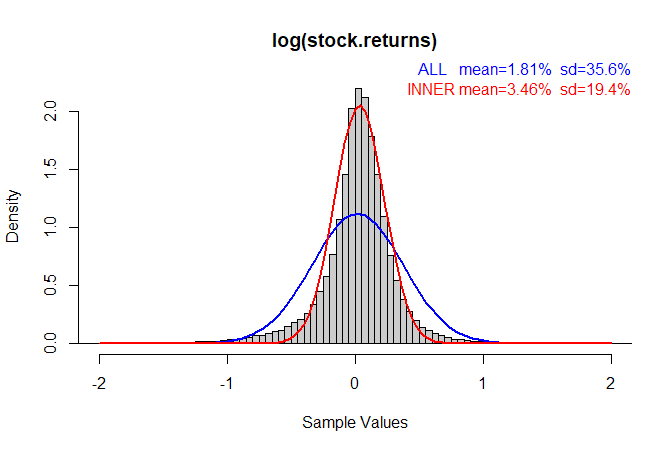
If I ask the computer to superimpose a "Normal" (Gaussian) distribution on the data I get the blue curve.
But something does not seem right here. The blue curve really does not follow the histogram's shape very well at all even though it was derived from the mean and standard deviation of the sample data.
The red curve seems to fit better near the middle of the histogram but it falls too quickly towards the tails which are "fatter". The red curve is generated by discarding the outliers before computing the mean and standard deviation first.
What this plot shows very clearly are the "fat tails" which Taleb talks about extensively in his books. The outlier stock returns happen more frequently than you would expect from a normal probability distribution. (Note: "Normal" here does not mean "normal" in the colloquial sense, but in the mathematical sense of a very specific probability distribution. It is called "normal" for interesting reasons.)
Let's look at a QQ plot of the data in the histogram. A "QQ" (quantile-quantile) plot is a plot where real sample data (in this case log(stock returns)) is placed in order and plotted against the same number of points taken from a theoretical distribution we want to compare the data against (in this case the Normal distribution.) The number labels on the X-axis are in "sigma", i.e. how many standard deviations from the mean the data is.
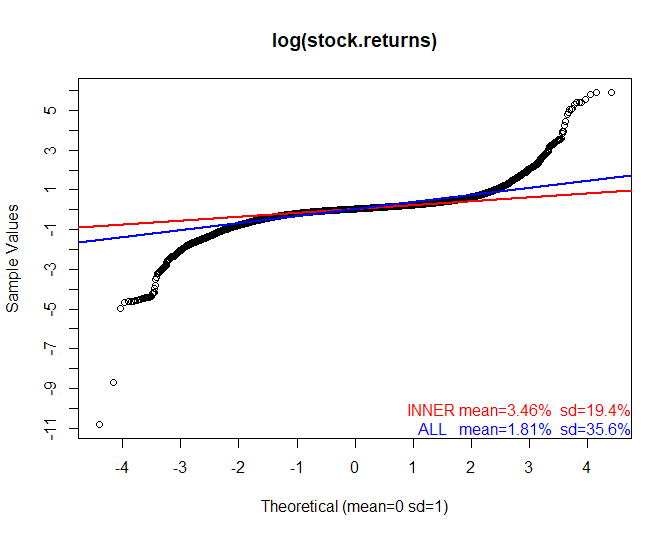
Any deviation from the theoretical distribution stands out very clearly as a deviation from a straight line. What we see is that the…