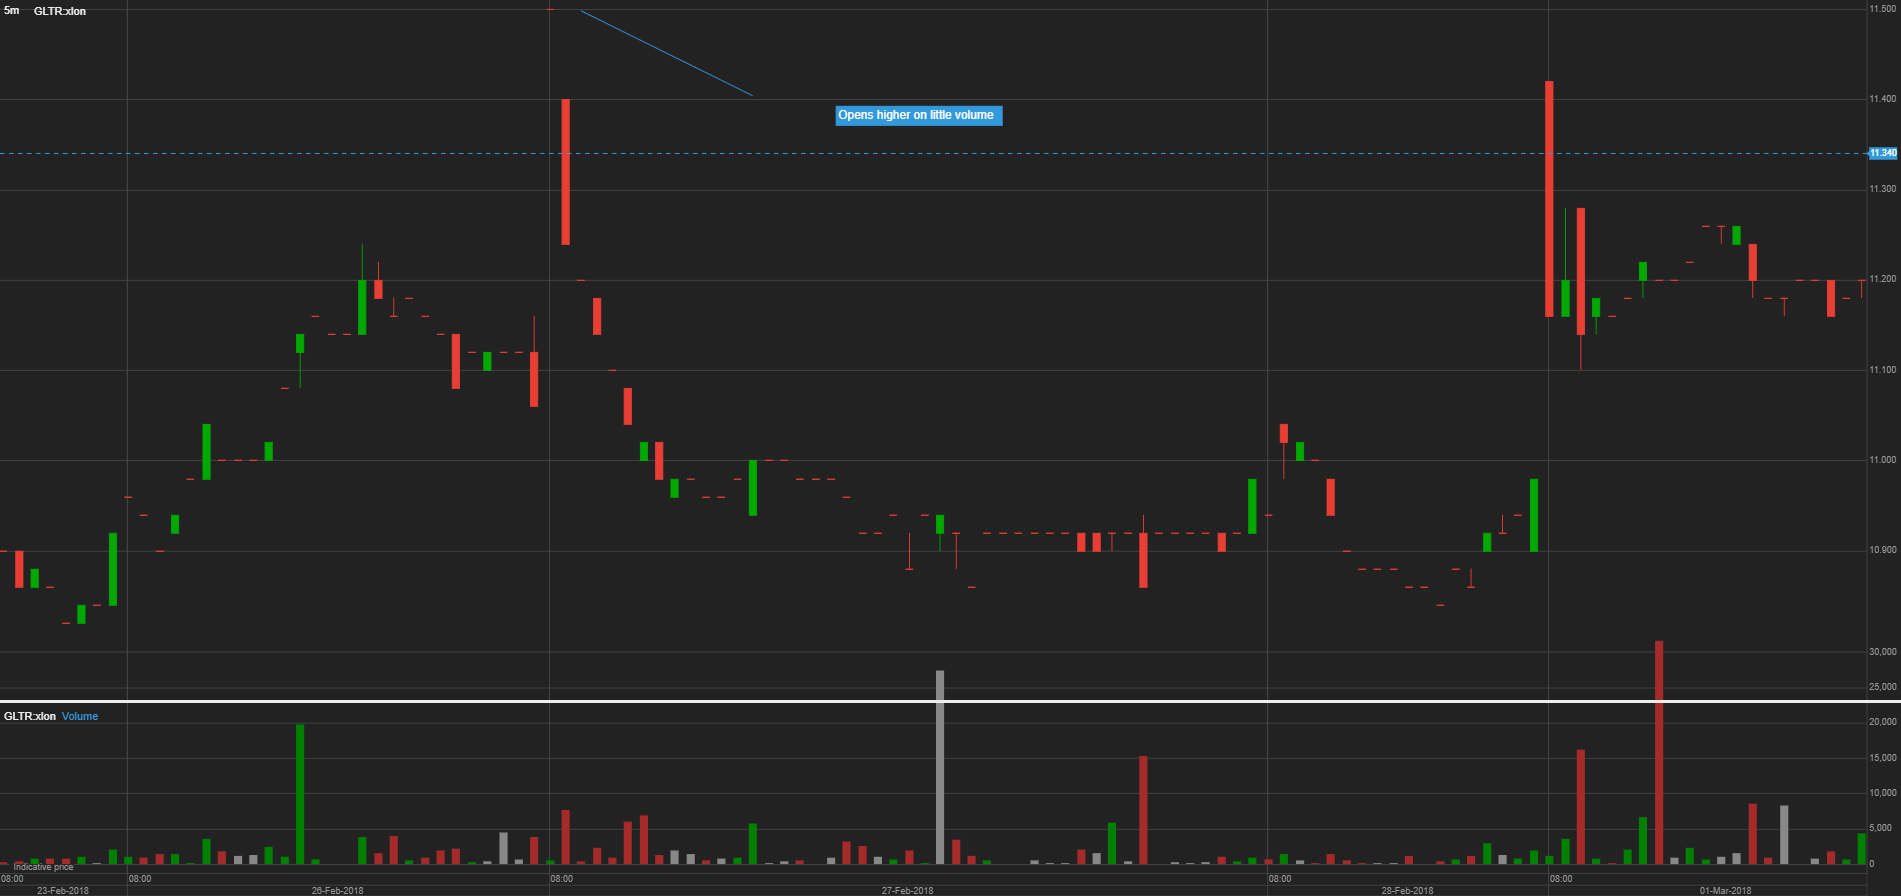
I understand candle basics but this one has me stumped. The company is Globaltrans Investment (LON:GLTR). The odd candle is an open at an all time high on little volume, that then falls through the day. My theory is this is due to underlying currency movements overnight, but was wondering if more experienced traders could give another possible interpretation?
It isn't the first time this has happened so I suspect something structural.
Chart 1: daily view:
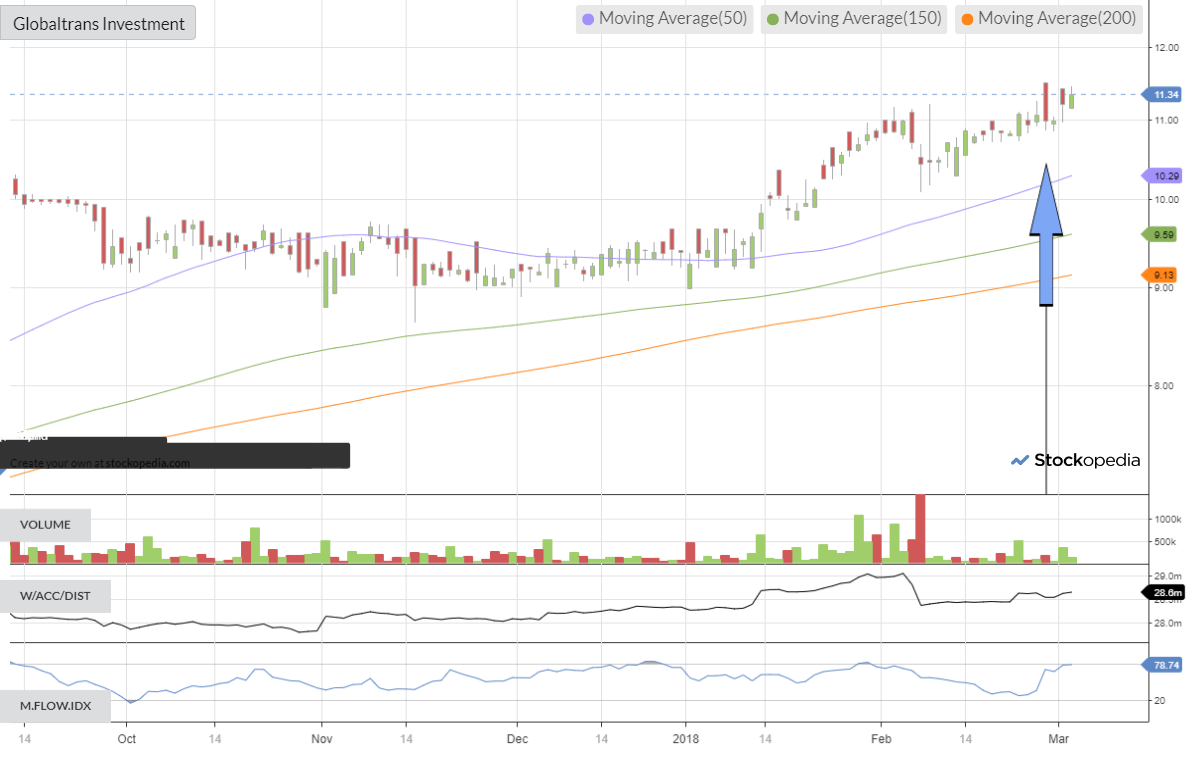
Chart 2: 5 minute view
Right click and open in a new window to allow zooming.