Thanks for the great comments on yesterday's post which showed Swarm Plots of the StockRanks across the market. Someone asked which stocks and sectors have shown Relative Strength this year - so I thought I'd run the numbers and draw something else for your amusement.
If you aren't familiar with Relative Strength let me brief you. Relative Strength is the share price performance any share relative to the market index. In the UK, we use the FTSE All Share as the benchmark and publish a range of these figures on StockReports.
It is calculated by dividing the price change of a stock by the price change of the index for the same time period. For example you'll find scenarios like this:
- A stock falling by 20% versus an index rising 20% would lead to a Relative Strength of -33% (0.8/1.2-1)
- A stock rising by 100% versus an index rising by 30% would have a Relative Strength of 54% (2/1.3-1)
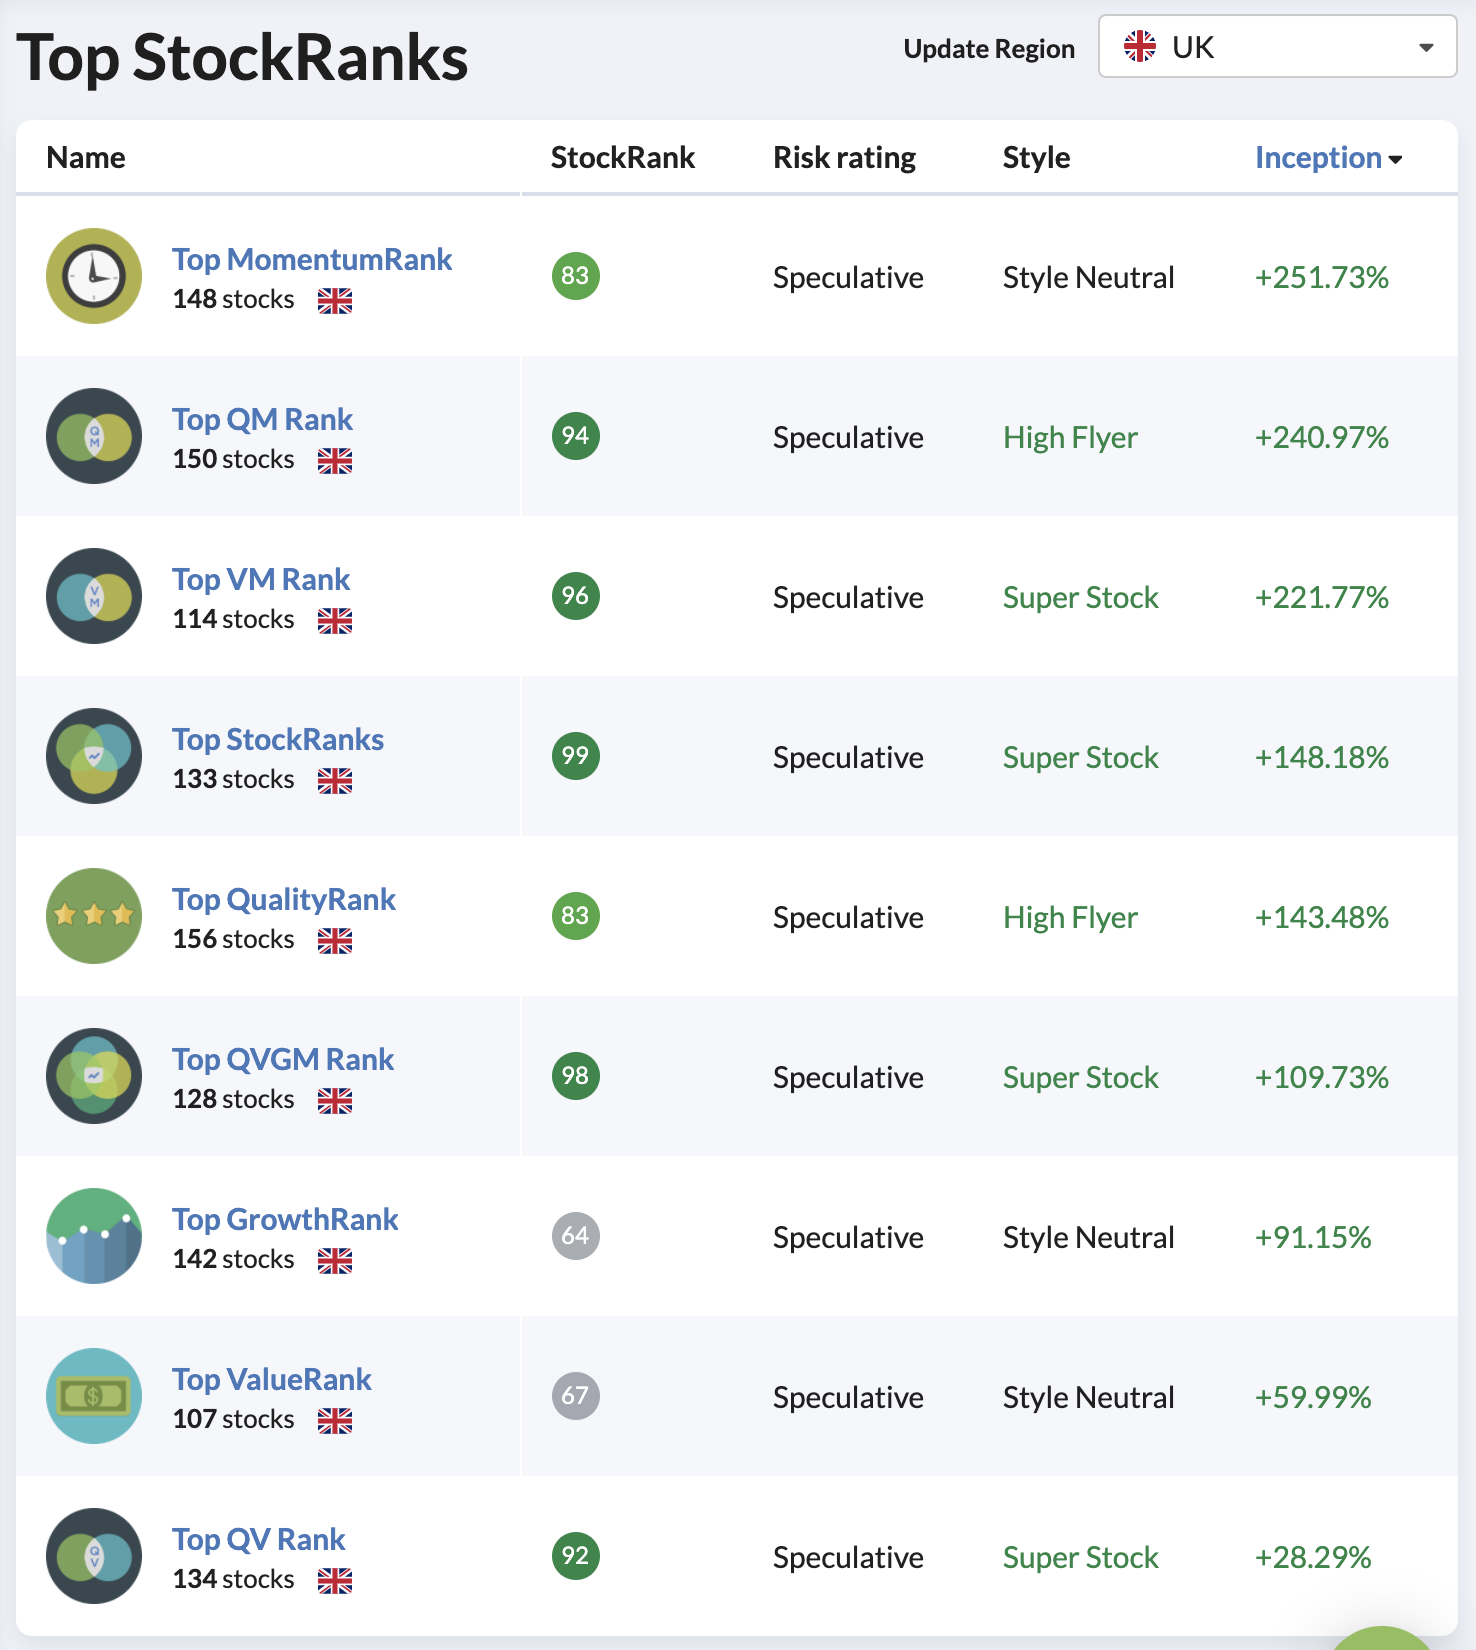
Relative Strength has been proven, time and again in so many academic studies to be highly predictive of future returns - so we use both 6 month and 1 year Relative Strength as key components in the Momentum Rank. I know it's strange, but strength tends to persist. If you are interested, I've written on the best timeframes for momentum indicators before.
For the following chart I've ranked a composite of the 1 year and 6 month Relative Strength numbers for every stock in the market split by Sector - it's in the vertical axis as "RS Rank".
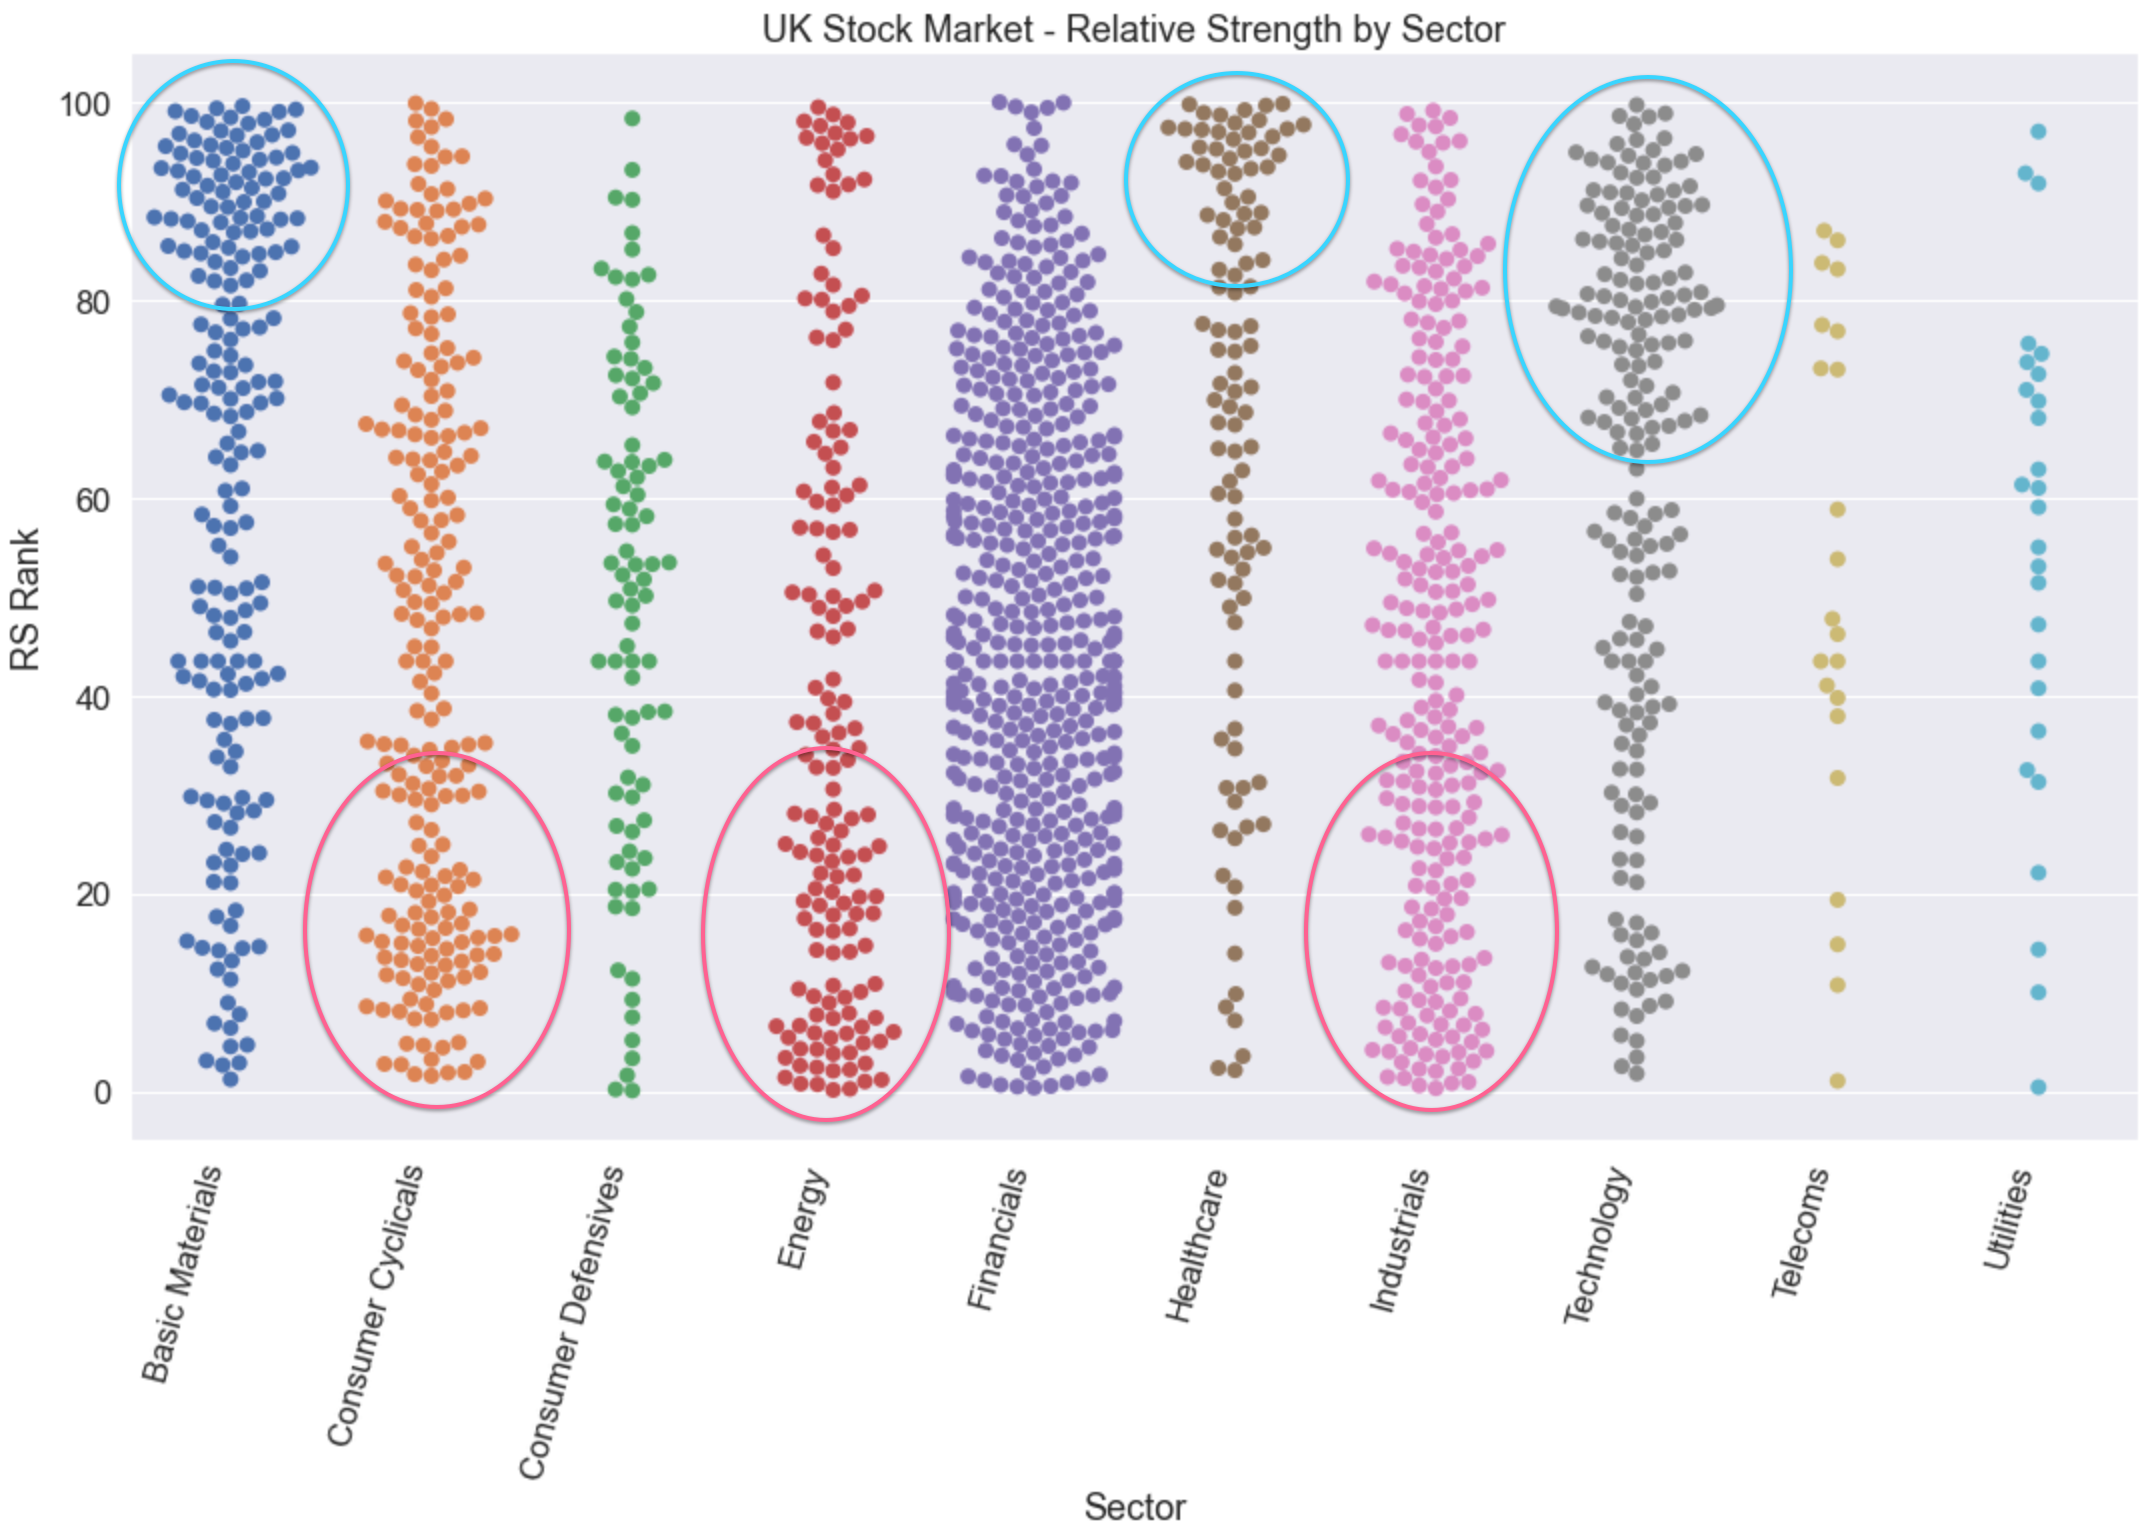
You can immediately see a few takeaways:
- Circled in Blue - strong relative strength in shares in the Basic Materials (hard assets), Healthcare (Covid) and Technology (work from home) sectors.
- Circled in Red - weak relative strength in Energy (who is driving?), Consumer Cyclicals and Industrials (due to the real world, cyclical nature of their businesses).
Of course, these generalities don't tell the full picture. There are pockets in these sectors that have contrary results.
- The pocket of high strength Energy stocks are mostly Renewable Energy.
- The Financials sector has very little high strength action at all (this does worry me as financials can be leading indicators)
- There are pockets of strength in the Consumer Cyclicals sector - mostly from durable goods companies benefiting from consumer spending.
If you do…