Hi,
I’ve heard the term, going up on higher volume a lot and just wondering if there’s a short cut rather than looking at the charts. Below is a list of a few companies, with the 52 low date, sum of % gain days with volume* and sum of % loss days with volume*. *From the 52 low date. 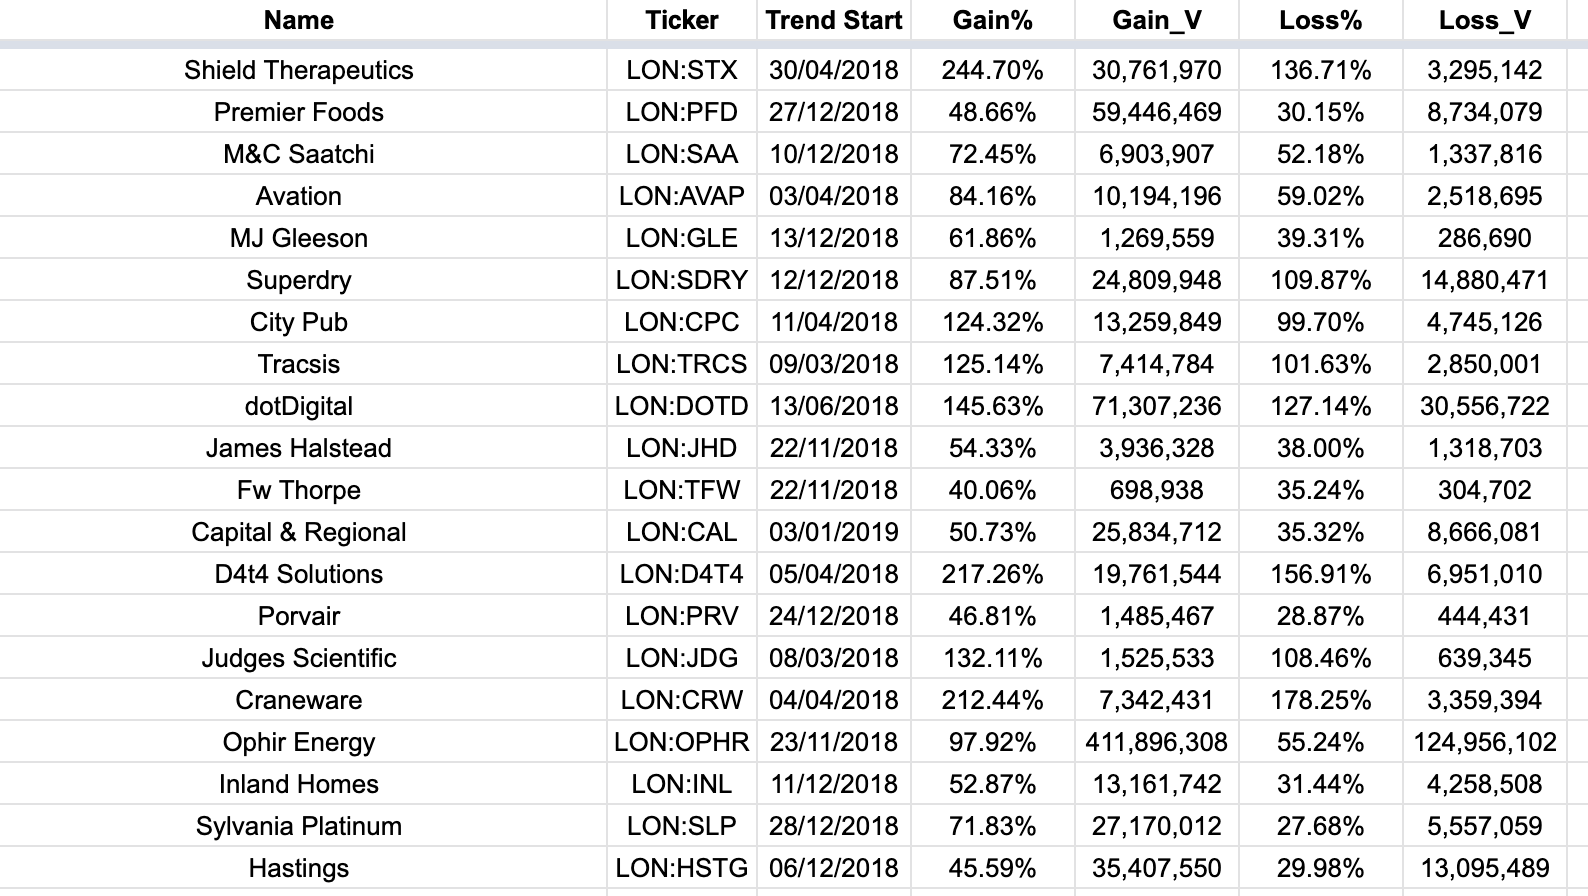
Question is - does the sum of the up days and down days show anything useful? Or is it more about the spikes in volume rather than the sum?
I would usually do a complete data back test of this but i feel like the stockopedia community can do better, so if anyone has suggestions on how to code something better - please let me know!
Thanks