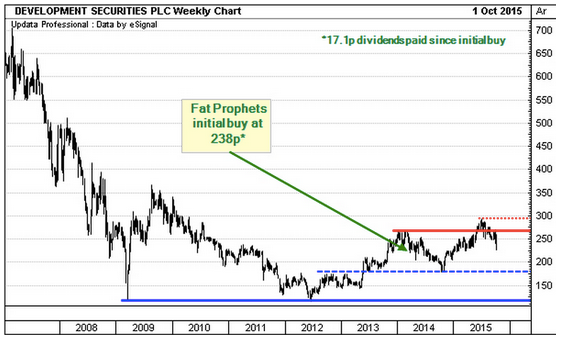
The UK and Irish real estate group Development Securities had a basic NAV per share of 276p at February 2015. The current share price of 242p gives a 12% discount to the net asset value (NAV). This seems unwarranted given the scope for development gains over the next three years.
Development Securities is a real estate developer with a portfolio of mature investment assets. This mix provides cashflow to support the business and potential upside as new projects come through to completion.
However, the real estate development business model is precarious given cyclical demand and the use of debt. When the music stops companies with large unfinished projects are likely to experience financial stress.
Development Securities saw its share price fall from over £7 in early 2007 to £1.22 in mid-2012. The long-term performance has also been weak with the shares at around £4 in 1994 versus only £2.42 today.
However, the shares have performed well when there has been a period of economic growth. The group’s gearing has also been reduced in recent years and property completions are set to be strong over the next three years.
Development Securities’ near-term potential
Real estate developers generate value by taking projects through to completion and then selling them. Works in progress are conservatively valued on the balance sheet and so the sales should generate an increase in book value.
Development Securities expects the next three years to see strong gains from its development portfolio at an average of £56.5m a year. This compares to the £45.7m seen in the year to February 2015 and £27m the year before.
Expectations of gains to be realized across the portfolio
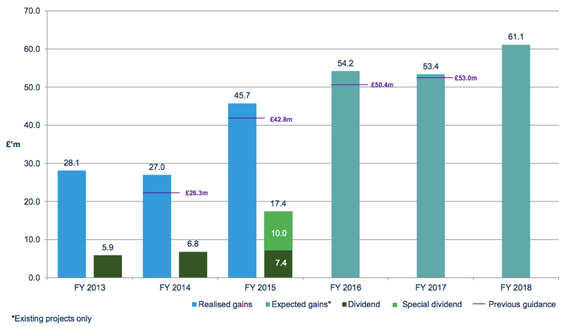
Source: Development Securities investor presentation
In the year to February 2015 the NAV increased from 262p to 276p at the end of the period. This gain is after factoring in the payment of an ordinary dividend for the year of 5.9p for the year and a special dividend at 8p.
Balance sheet improvement
The scope for setbacks in the medium-term has been reduced by a fall in balance sheet gearing. At February 2015 gearing came in at 38.3% versus 48% at the start of the year.
Including joint venture debt and gearing at February 2015 was 48.5% versus 56.8% at February 2014 and 63.9% at February 2013. Interest payments are supported by the income from mature investment assets as well…