Data analysed on 10-Aug-2014
Firstly, a thank you to Stockopedia member ‘Mechanical Bull’ whose earlier post set me off down this route.
Mechanical Bull: A Riddle Solved Saturday, Aug 09 2014 - See more at: http://www.stockopedia.com/content/mechanical-bull-a-riddle-solved-85265/?comment=3#3
This is a data sorting exercise to analyse the distribution of stocks selected for Guru Screens in Stockopedia. I plan to repeat this data collation exercise on a monthly basis. The hope is that changes in these distributions may prove useful in highlighting trends.
I present the data in two forms :
CASE RATES - a straight count of qualifying screens per index and per screen style. (Charts/Tables 1+2)
BASE RATES - a weighted version that shows how likely it is that a stock chosen at random from within it's index will qualify for the Guru Screens and Guru Styles. (Charts/Tables 3+4). I believe that the Base Rate data will be more informative.
CASE RATES
Table 1 : Number of Qualifying Stocks by Index
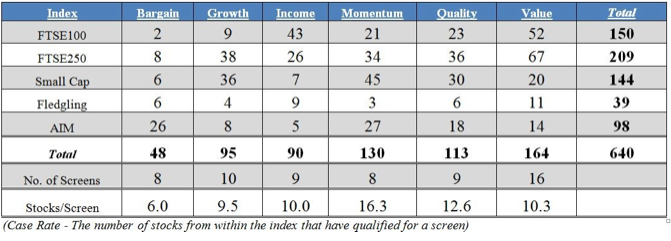
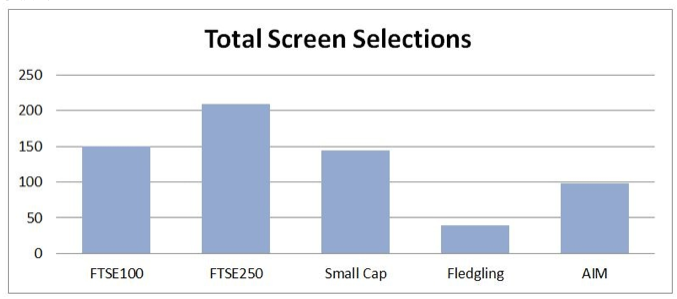
Chart 1: Number of Qualifying Stocks by Index
One stock can qualify for multiple screens and/or multiple styles. E.g. SBRY qualified for 5 screens (2x Income, 1x Quality, 2x Value) and contributes 5 towards the FTSE100 total screens.
On the face of it, the FTSE 250 has the most screen qualifiers. However, this is the Case Rate, if we look at Base Rates then we get quite a different picture.
Table 2 : % Qualifying stocks by screen style
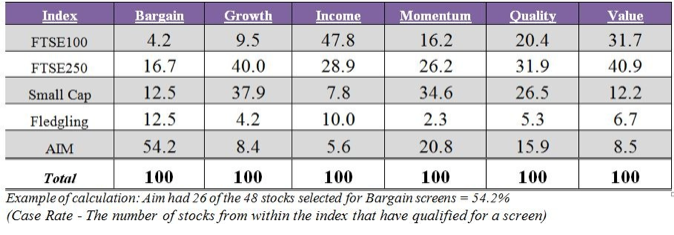
Chart 2 : % Qualifying stocks by screen style
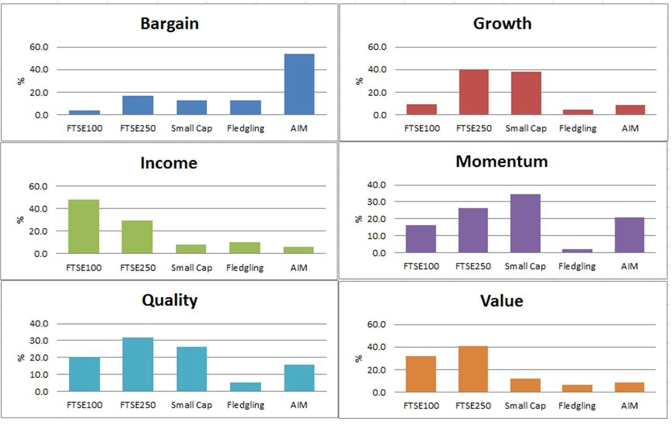
This chart shows where the Case Rates peak for each Guru Screen Style.
e.g. Over 50% of stocks qualifying for ‘Bargain Screens’ come from AIM index stocks. However, if we look at Base Rates we will see a very different picture. There are many more AIM index stocks than there are FTSE100 stocks so we get a skewed picture when just looking at Case Rates.
BASE RATES
Table 3 : % Chance of qualification for one or more Guru Screens
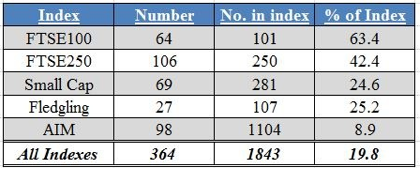
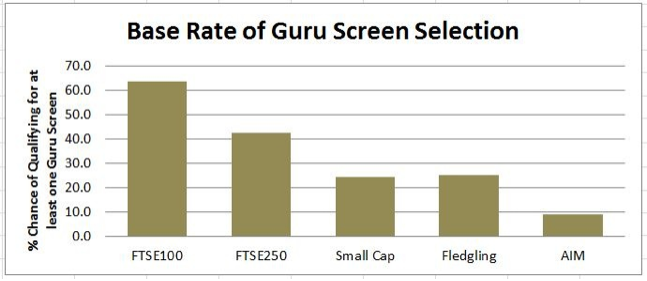
Chart 3 : % Chance of qualification for one or more Guru Screens
One stock only counts once even if it qualifies for multiple screens and/or multiple styles.
e.g SBRY only counts as 1 in this section.
This allows us to look as Base Rates – the underlying statistics that show how likely it is that…