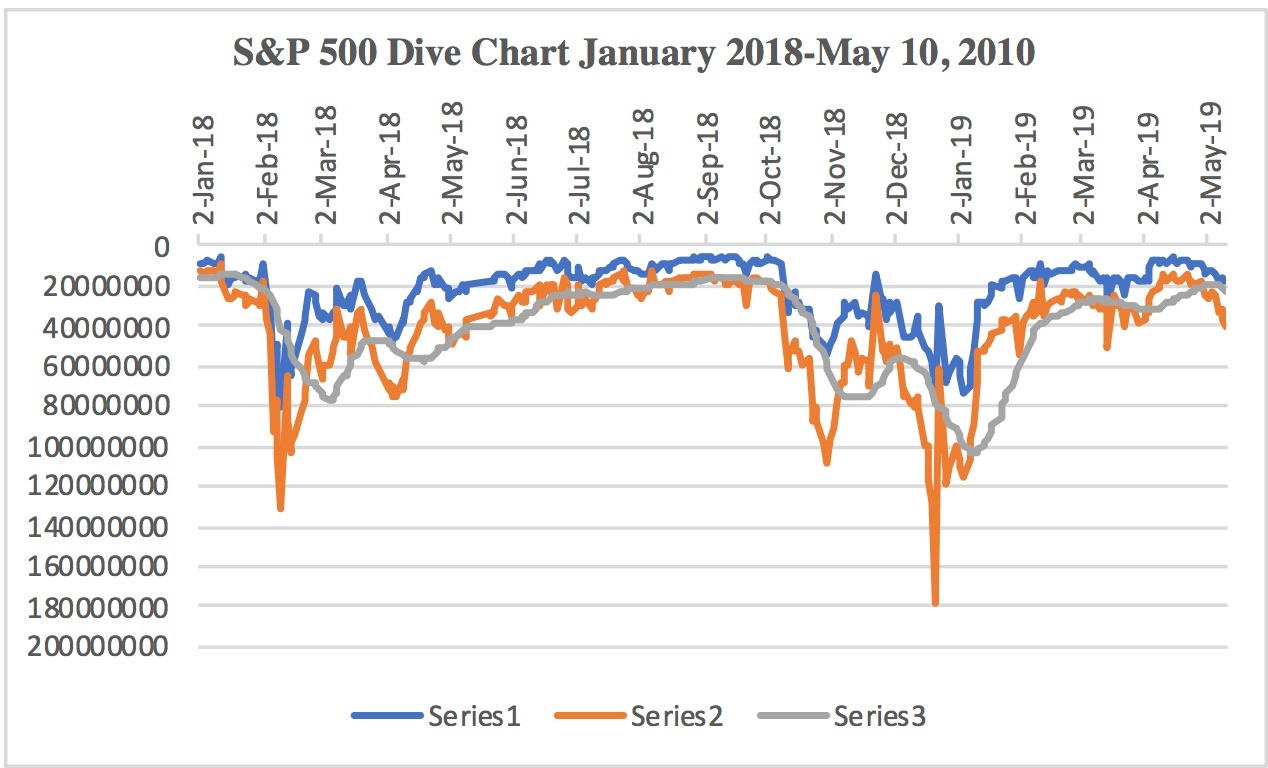
By Friday, May 10's close the S&P 500 Dive chart had reached a low only seen three times since January 2018 (see below). This took place February 5, 2018; October 10, 2018; and March 15, 2019. The first two ushered in sizable drops while the later was a minor wiggle on the way to the eventual high we saw May 1st.
The first two instances, however, should give us pause. By February 5 the S&P had already gone through a January 26 intraday and closing high of 2872.87. This was followed by consecutive drops of 0.67 and 1.09% and two days where the market closed essentially flat after moving intraday within a 0.8-0.9% range. Then on February 5 the index dropped 2.12% and followed that drop with a 4.10% drop the next day en route to an eventual 11.8% loss by its February 9 intraday low.
The S&P 500 had already set an intraday high of 2940.91 September 21 when it wobbled and inched back to an intraday high of 2939.86 October 3. The index lost 0.82 and 0.55% the next two days and then minimized losses the next two days (0.04 and 0.14%, respectively) before dropping 3.29% October 10. Once again, the previous two flat days were not particularly volatile with a range of 0.95 and 0.71%, respectively. And once again, the index dropped sizably, 2.06% this time, October 11 before eventually reaching an intraday low of 2603.54 October 29 for an 11.5% loss.
I have previously discussed in "Act Two" how major bear market second peaks have a relatively quiet first 10 trading days after the high before a rise in volatility brings steeper losses for the remaining first 30 or so trading days. Curiously, the October 10 and 11 losses came at trading days 13 and 14, respectively from the September 21 high.
March 15 presented a different scenario. The S&P 500 was at the time making a remarkable recovery from the December 26, 2018 intraday low of 2346.58. By Monday, March 4 it had steadily climbed to an intraday high of 2816.88 for a 20.0% gain from its low. The index lost ground each of the following days that week but losses were contained at 0.11, 0.65. 0.81 and 0.21%, respectively. A big gain day March 11 (1.47%) was followed by minor gains of 0.30 and 0.69%…