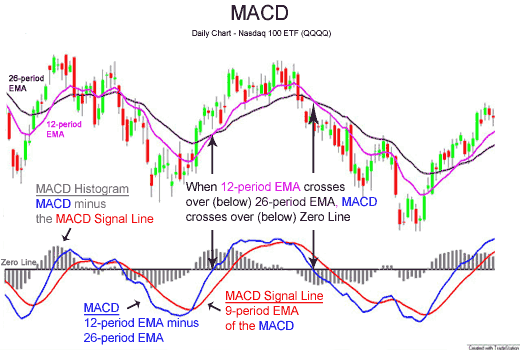
As part of a series looking at technical/momentum indicators, today we're going to look at MACD.
Developed by Gerald Appel (publisher of Systems and Forecasts) in the late seventies, the rather grand-sounding "Moving Average Convergence-Divergence (MACD) indicator" is actually one of the most commonly used momentum indicators around. It is used to spot changes in the strength, direction, momentum, and duration of a trend in a stock's price.
What is MACD?
The MACD is just the difference between a 26-day and 12-day exponential moving average of closing prices (an exponential moving average or EMA is one where more weight is given to the latest data). A 9-day EMA, called the "signal" (or "trigger") line is plotted on top of the MACD to show buy/sell opportunities.

Why is the MACD useful?
The reason that traders pay attention to varying lengths of moving averages is because they want to figure out how the short-term momentum is changing relative to the longer-term momentum. If the short-term average rises faster (slower) than the long-term average, the MACD moves upward (downward). Traders use this to suggests that the buying pressure is increasing (decreasing).
Interpretation
One of the reasons that MACD is so popular is because its trading signals are fairly unambiguous. You can see a good video introduction to its usage here but, in summary, there are three popular ways to use the MACD: crossovers (signal line or centre-line), overbought/oversold conditions, and divergences.
1. Crossovers
a) Signal Line Crossover - The basic MACD trading rule is to sell when the "slow line" of the MACD falls below the faster 9-Day EMA line (known as a "signal line crossover") and similarly, a buy signal occurs when the MACD rises above its signal line.
b) Centre Line Crossover - It is also popular to buy/sell when the MACD goes above/below zero (known as a "centreline crossover"). Great momentum stocks stay above zero for a long period of time. Cross overs below zero are usually be ignored since the stock is weak and it is said that trends can not be predicted as easily.
2. Divergences
Crossovers happen quite frequently. Another signal, considered more reliable but less frequent, is a pattern called bullish convergence. This is where the market price itself makes a lower low from a previous low but the underlying…


