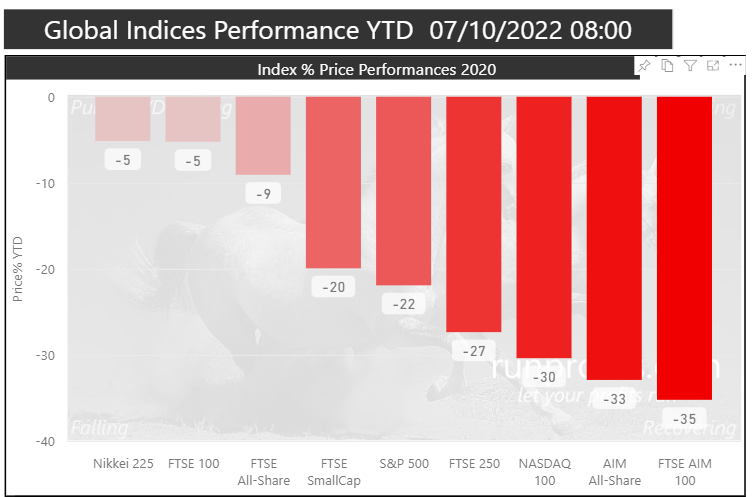
It’s rough out there. The long anticipated bear market is at last upon us. In the UK, the FTSE All Share has fallen 10% in the year to date, while AIM - where stock pickers like to congregate - has fared even worse. In the US, the S&P 500 - a long-time haven for passive investors - is down more than a fifth.
We shouldn’t be surprised. Global markets have been propped up by excess liquidity for years and now that froth is draining away, there are few places to hide. Not even the bond market can provide a safe haven . At the end of September yields on 10-year government bonds rose to match those of many high-yielding funds. That means loans to the government are currently considered to be as risky as equity investments. Interest rate hikes - an emergency measure to help the economy deal with spiralling inflation - hasn’t helped the problem, contributing to massive stock market outflows as investors have sought the perceived safety (and rising returns) of cash in the bank.

And so investors are fearfully recalling the last time a liquidity crisis of this scale threatened to tumble global markets. It was the turn of the millennium and money that had pumped up tech stocks was being withdrawn fast. Then, the FTSE 100 fell from a peak of 6930 points to a trough of 3492 points over a span of three years.
This too shall pass
How long the sell-off will last and how deep it will go is a topic that Ed has been exploring. His first analysis into private investors’ favourite market, the AIM All Share, is slightly depressing. If previous drawdowns are anything to go by, the current crash has someway further to go before we hit the true market bottom.
Examining the FTSE 100 since its foundation in 1984 presents similarly worrying statistics. Market drawdowns (from peak to trough) have varied from 9 weeks (the Covid-19 sell-off of 2020) to 166 weeks (during the dotcom bust).
So, for argument's sake, let’s say we’re roughly half-way through this drawdown. Examining the performance of the FTSE 100 at similar points during each of the previous major drawdowns should provide some comfort. At not one point has the market failed to recover its peak within five years. The following chart shows the performance of…