This is the fourth in a series of education posts from Alan Hull. Alan Hull is a renowned technical analyst within the Australian Market. He has educated thousands of investors on how to apply technical analysis within their overall strategy. In this special series, Alan has agreed to share his Technical Analysis tutorials with Stockopedia members. He has committted to provide one ever three weeks. To learn more about Alan you can read his profile here. Or visit his website alanhull.com.au
To re-acquaint yourself with Alan's prior postings, please go to “Discuss” in the left hand column and selecting “Aus/NZBlogs” (see below)

Trendlines
There are actually 3 types of trends in the Stockmarket. A sideways trend (as represented by a support/resistance line) is where the price activity moves horizontally across a chart. An upward trend occurs when price activity moves upward from the left of a chart to the right. A downward trend is where price activity moves downward from left to right.
This tutorial will deal with trendlines as they apply to both upward and downward trends. Sideways trends and support/resistance lines belong to a special category of trend and will be covered in a separate tutorial, a little later on.
When analysing an upward or downward trend a chartist uses trendlines. Trend trading is widely considered to be the most reliable method of trading financial markets. There is a common cliché that states ‘The Trend is your Friend’. There are traders and investors who trade against prevailing trends and they are referred to as ‘Contrarians’.
Important Note
The construction/placement of trendlines is subjective and chartists can have differing opinions on how they should be positioned on a chart. The method described below is the most conventional approach employed by chartists around the world.
In an upward trend, a trendline is constructed by drawing a line that touches two or more of the most significant lows. This line provides support to the price action and when broken by the price activity, indicates that the trend is weakening or may be over.
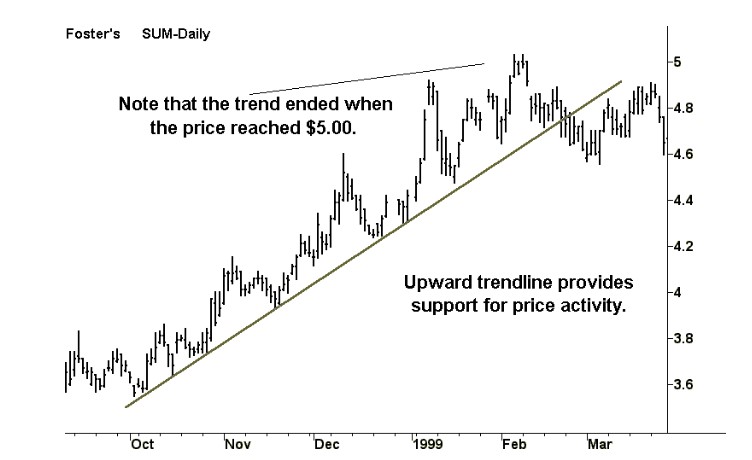
In the chart of Fosters Limited on the previous page, the trend ended when it ran into resistance at $5.00. The chartist would place a horizontal line at $5.00 knowing that this level will be of significance…