Updated April 21, 2018 from April 16, 2018
The market will likely go up at least 4.6% between now and August[1]. Thus, this might be a good time to hitch a ride on stocks that will outperform. Market leaders usually wind up also leading the charge into the climax so let’s see if any of the FAANG group are showing promising signs or giving us warning signals. I’ve already updated Facebook[2] so let’s look at Amazon, Apple, Netflix, and Google/Alphabet.
Amazon
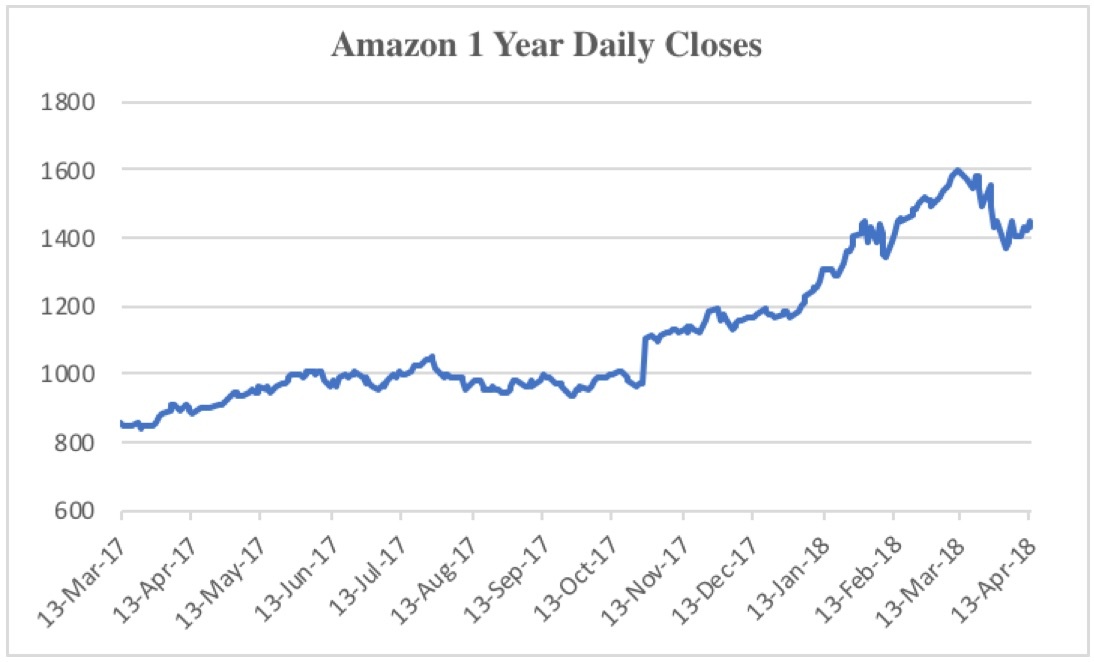
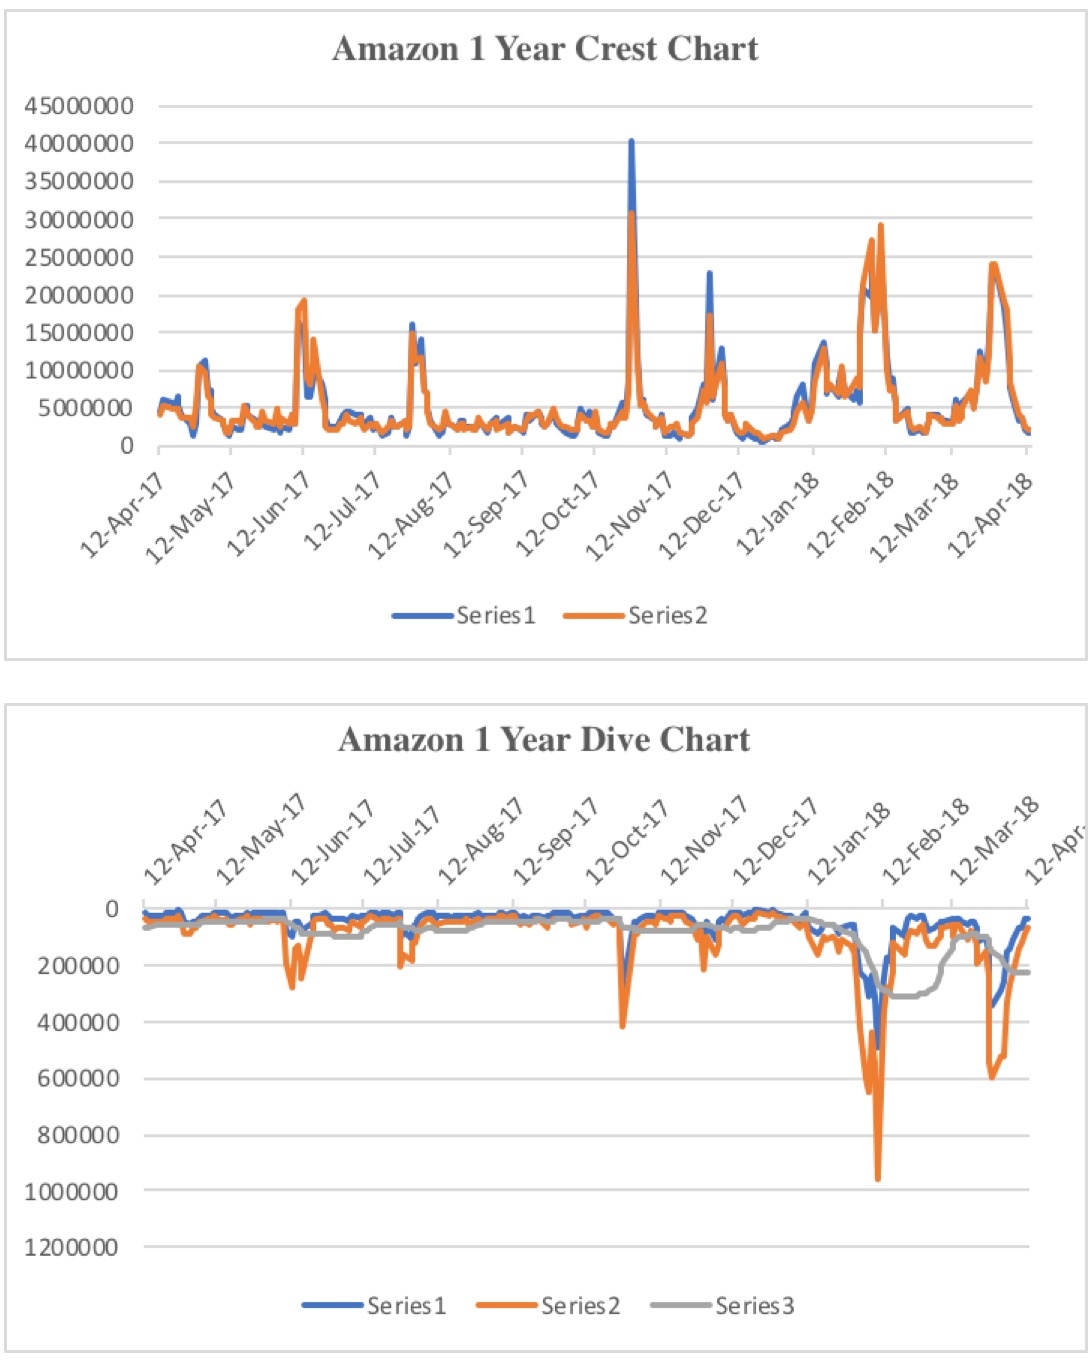
Amazon was tripped up the first two weeks of February along with the market. From an intraday high of 1498 February 2, it dropped 15.5% to an intraday low of 1265.93 February 9. The Crest chart rose above its long-term baseline back on January 16, warning investors that a top was near. It then shot higher February 1, the day before the top. The Dive chart had given a warning of its own three days earlier when it breached its lower channel January 29. The high that day was 1431. The expected low would have come at least 10% below that or 1288.
Thereafter, Amazon recovered even better than the market to its March 13 all-time high of 1617.54. It then floundered along with the market only to have a bout with the Trump-Twitter virus. The Crest chart warned on March 13 when it jumped above its long-term average. The Dive chart had yet to recover its lower channel at that time.
Today, Amazon’s Crest chart indicates the crest is over – no surprise. Its Dive chart is also quite promising. It is well inside the lower channel, indicating better days ahead.
Apple
Apple roller-coasted its way to a 170’s plateau in November. It eventually eked out a 180 high January 18. From there it dropped 16.6% to its 150.24 February 9 low, much as Amazon had done. Unlike Amazon, Apple was only able to ride along with the market to an eventual 183.5 high March 13.
Apple’s Crest chart mirrored its roller coaster ride. On October 19 it warned of an approaching top when the chart rose above its long-term baseline. The chart jumped again October 27 and would continue nervously until January. By comparison, this was mostly a…