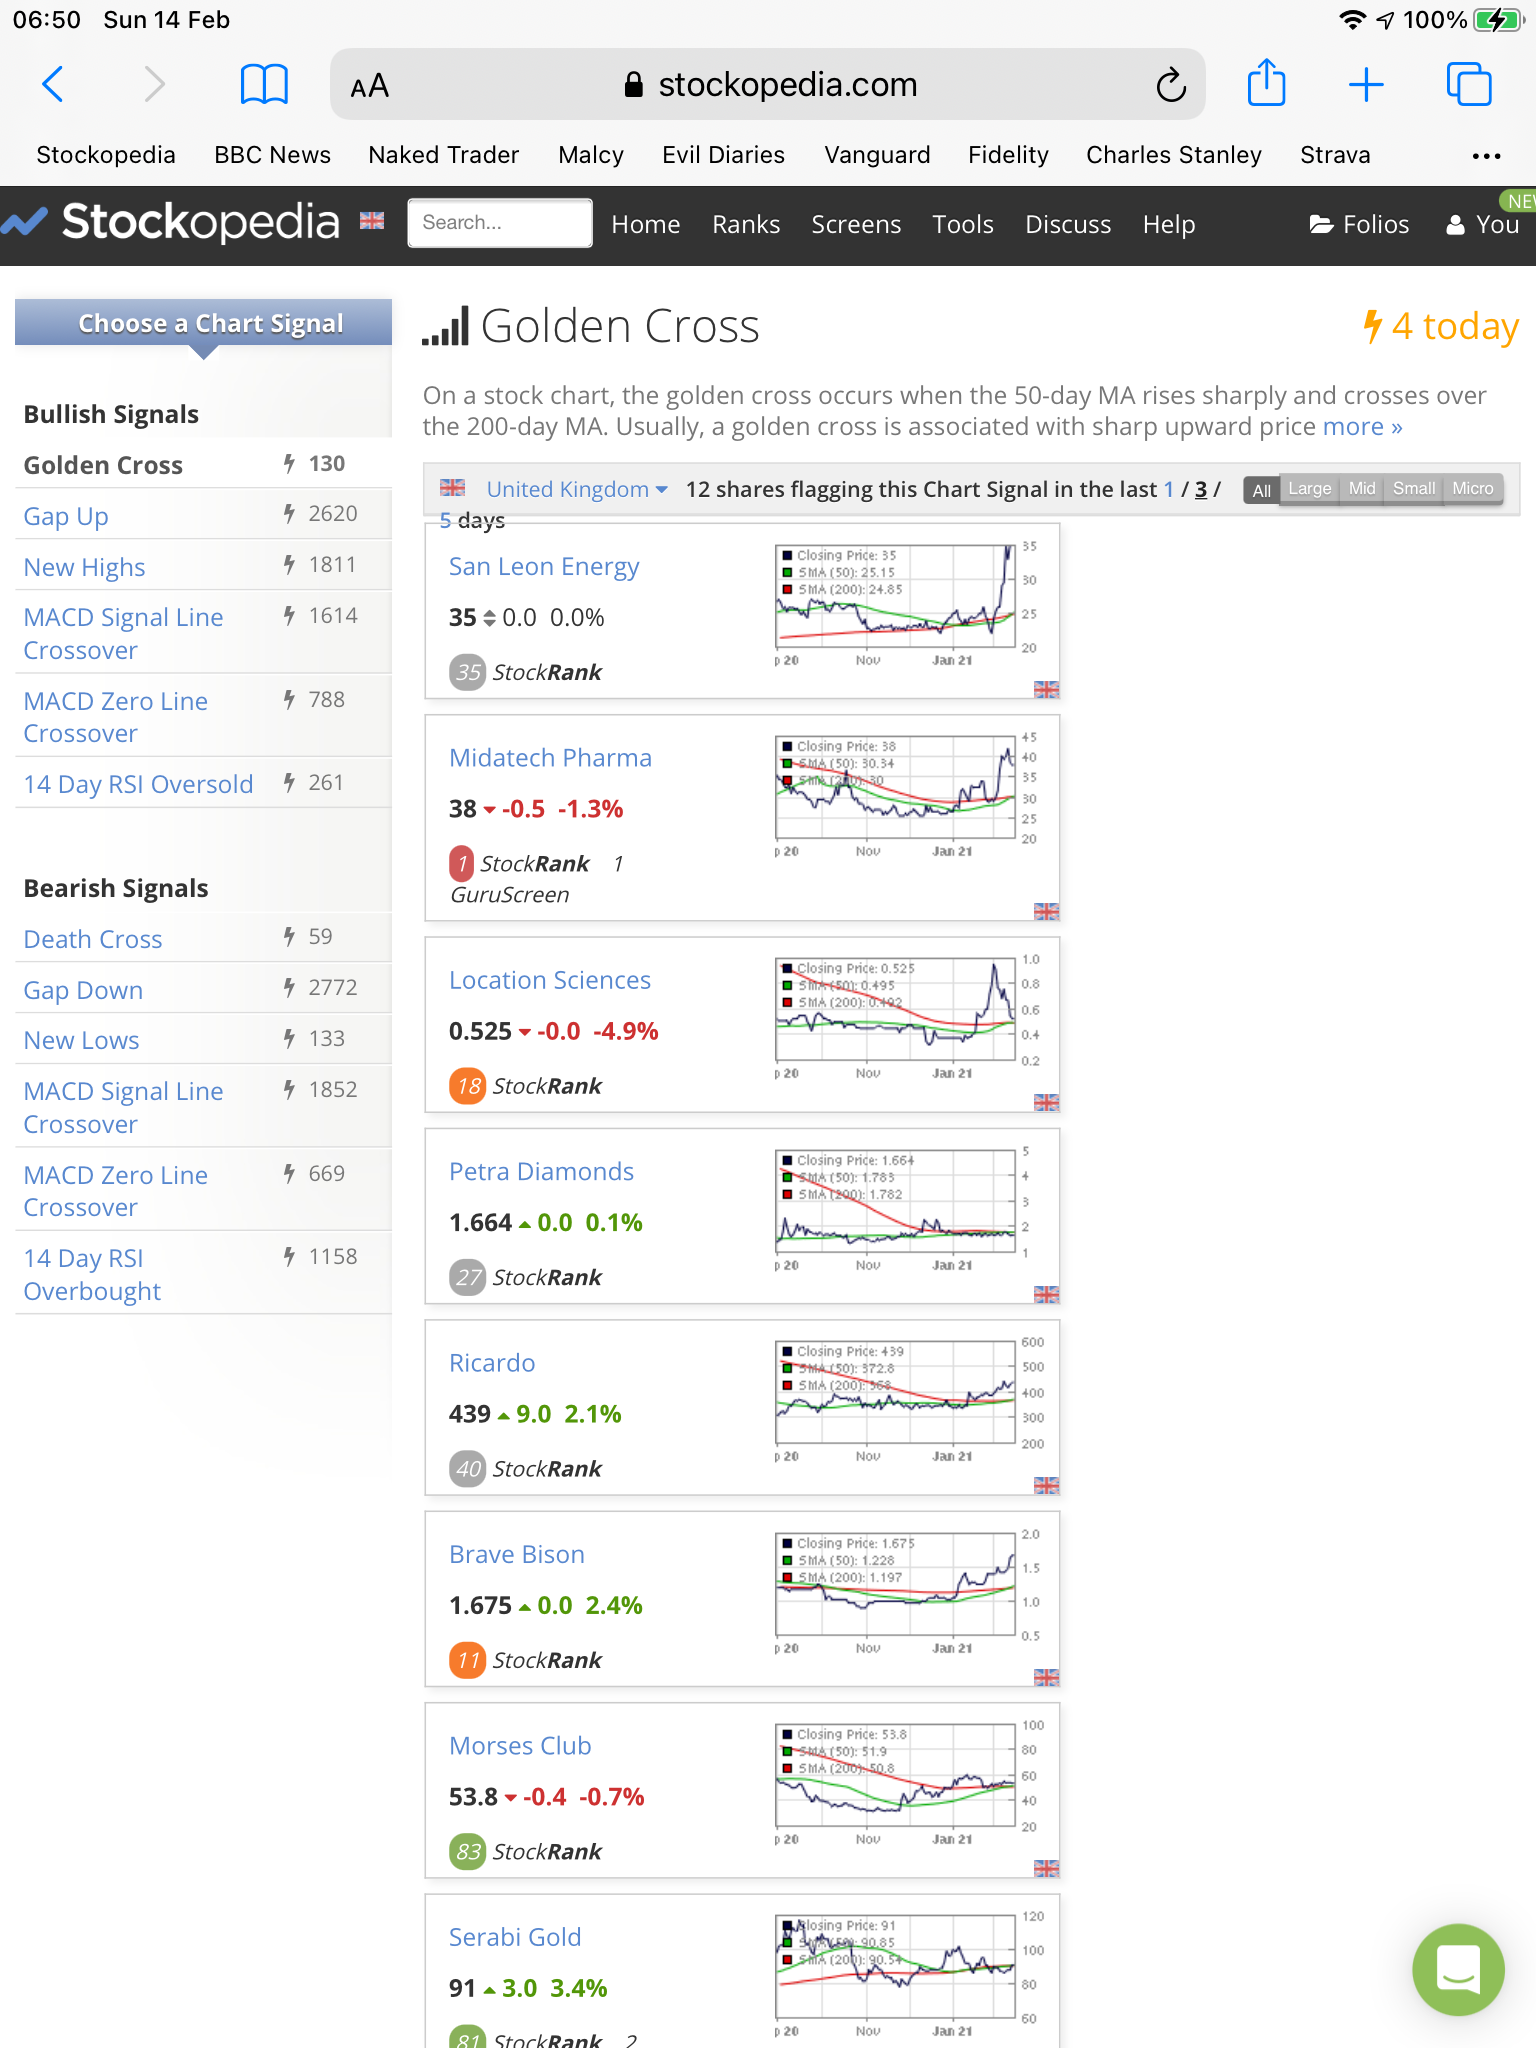
I have used stockopaedia to create a "golden cross" screen using the model suggested in the charting section. (50dMa/200dMa>200%, rank of 50dMa/200dMa%>95).
This has produced 12 results: Kr1 (OFEX:KR1) Wishbone Gold (LON:WSBN) Zoetic International (LON:ZOE) Braveheart Investment (LON:BRH) Argo Blockchain (LON:ARB) All Active Asset Capital (LON:AAA) Anglesey Mining (LON:AYM) (LON:AFC) Rainbow Rare Earths (LON:RBW) Panthera Resources (LON:PAT) European Metals Holdings (LON:EMH) Eqtec (LON:EQT) £AFCenergy
However - for Eqtec (LON:EQT) Wishbone Gold (LON:WSBN) Rainbow Rare Earths (LON:RBW) and Panthera Resources (LON:PAT) the cross hasn't actually formed (50dMA approaching 200dMa but hasn't crossed it) - have I built this screen wrong or am I misinterpreting the golden cross? I thought it occurred when 50dMa became greater than 200dMa?
Very grateful for any advice.