*** Reposted after fixing major flaws in original analysis ***
I have been using Stockpedia's high StockRanks as the basis of my investment strategy since they were first published in 2013. Since then I have more than doubled my capital.
However, the last year has been very challenging. My total wealth is down over 6% since the start of the year and more than 8% since it peaked in late January. These falls would have been considerably worse had I not been diversifying my investment portfolio by moving into other asset classes, including a large chunk of cash. I have also been shorting selected stocks which has worked to some degree.
Even during the first few years of using high StockRanks I became aware that it did not work all the time. However, this year they seem to be performing particularly poorly. I thought it would be useful to do some analysis and get a better handle on what is going on.
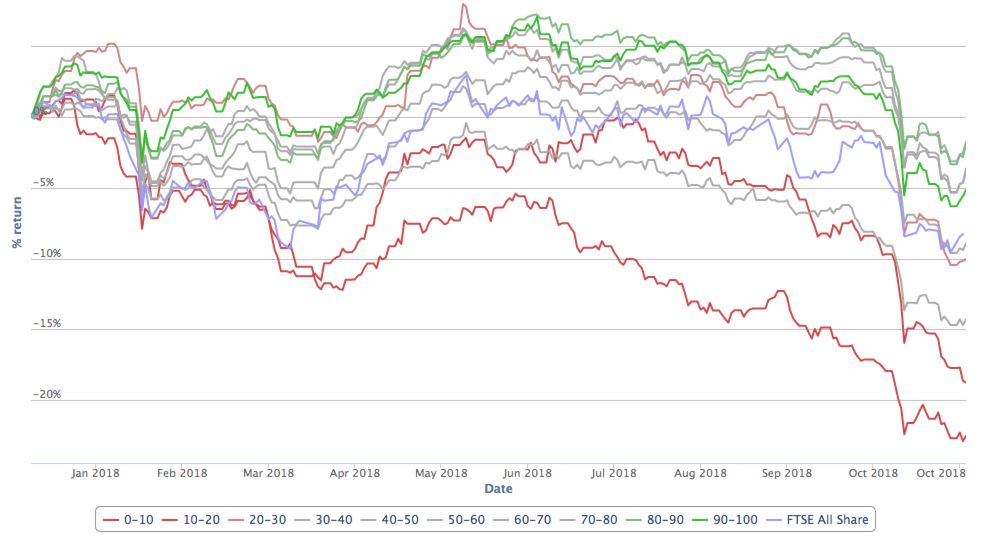
I started by collecting the weekly values of the UK top decile QVM stocks (source: https://www.stockopedia.com/st... ). I then decomposed this series into 2 components:
1. The extent to which overall returns are attributable to the change in the overall market (usually referred to as 'beta').
2. The extent to which overall returns are attributable to a specific strategy (usually referred to as 'alpha' or sometimes 'excess returns'). In this case the strategy is buying from the top decile StockRanks and rebalancing quarterly.
For calculating the market return I have used the FTSE All Share index. The results by calendar year are as follows:
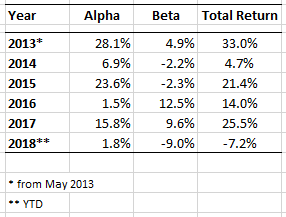
This shows that total returns are pretty good for all years apart from 2014 and 2018. Although 2016 delivered a healthy 14% return, most of this was in fact due to the overall market conditions and iin fact alpha made little difference. So far, 2018 has produced the worst (and only negative) total performance. However, this is mainly explained by the overall drop in the market. Alpha returns are so far this year have been poor but are no worse than 2016.
Alpha performance by year seems to show quite an interesting pattern of very strong returns in one calendar year followed by more modest excess returns in the following year. However, these annual results give a pretty coarse…