So I'm learning more about Candlesticks and Heiken Ashi and their relative merits and pitfalls. Any opinions of these relative merits are welcome btw.
But I have a specific question about charting these in excel.
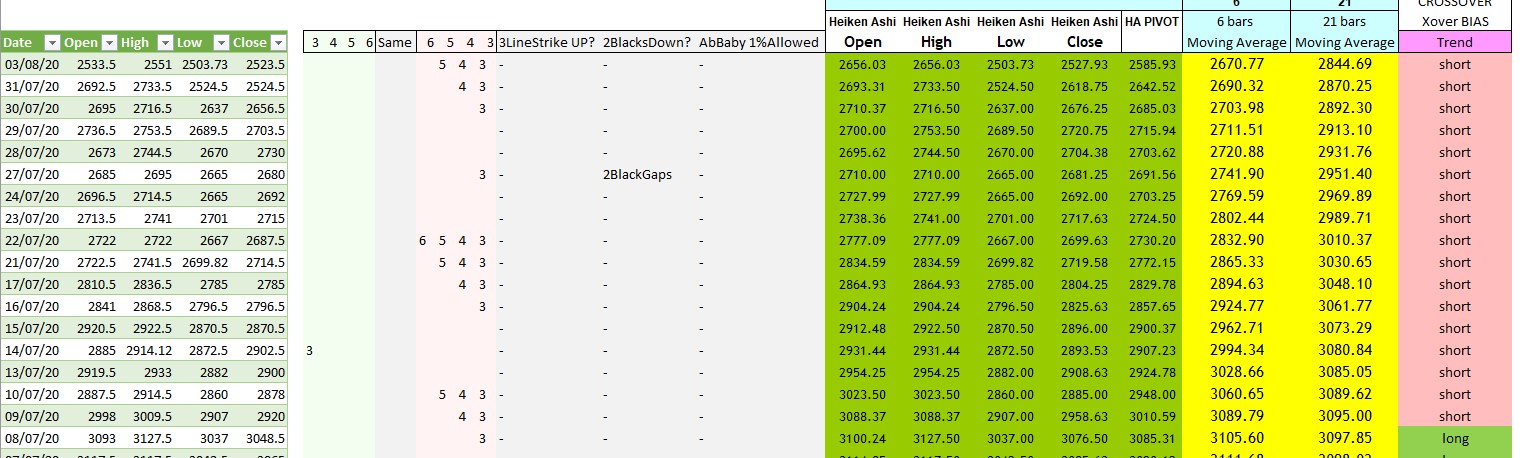
I have managed to get the formula for Close , High and Low all correct and agreeing with the rest of the world (I'm working on British American Tobacco (LON:BATS)).
I cannot get my Open figure to agree.
I am using the very simple formula of (Previous Period real stock Open + Previous Period real Stock Close)/2. The average of the previous days open and close. This seems to be the accepted and published formula?
I've tried using various combinations of the real prices and the Heiken -Ashi prices.
This will not agree with the rest of the world.
Where am I going wrong?
Thanks
W.