Introduction
They say Britain is a nation of shopkeepers; now it is turning into a nation of property owners.
The shopkeeping part is being weaned down resulting in massive publicity on bankruptcies like Woolworths and BHS.
So, what makes property in the UK so treasured?
Let’s find out.
The most famous housing chart
When
the media talks about property prices they are very likely related to this
graph:

Source: MeasuringWorth.com and Nationwide.co.uk.
These measures are on average home prices and average salary meaning it includes earnings of the very rich; this distorts the averages.
For example, the top ten best-paid CEOs have a collective salary of £156m and the UK average salary is £27,195, therefore it’s the equivalent salary for 5,736 people.
A more accurate measure is the median disposable income because if the UK has a total of 30m workers, the data will give you the earnings from the person in the middle or 15 th millionth.
Also, it’s income after tax data, which helps to avoid any distortion if one is paying high taxes.
And
this chart tells you a different story:

Source: Nationwide.co.uk and Telegraph.co.uk.
First it is much more volatile, and second, it presents some interesting findings.
Back in 1970, you can afford a house for working less than one year and its salary after tax!
Now, it’s over 11 times’ your disposable income, though it varies from regions to regions, on average home prices have risen 13 times faster than median disposable income.
Who or what is to blame for this property price bonanza?
1. Population and Migration
The raw way of looking at it is to compare the number of
homes against change in UK population:
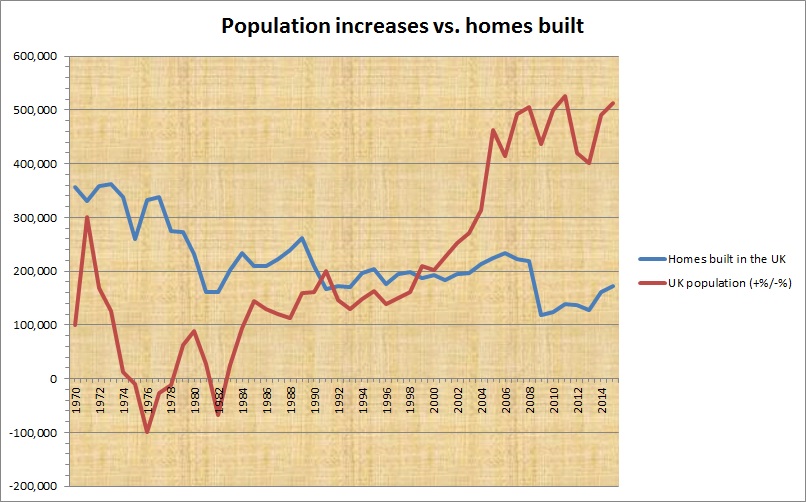
Source: ONS.gov.uk. (Graph created by the writer)
The number of homes built has steadily declined while the annual increase in UK population is up by half million from the 62,000 during the 70s.
For the above chart to be meaningful, you got to know how many people will occupy these new homes then compare to UK population increase.
Therefore, you required the average household size per home data, as shown below:
|
Decade … |