.

What system did you use to do the plotting?
.
Investor, Trader and Financial Educator As a long term investor/trader I have consumed hundreds of financial books and endured countless hours of self education. Hopefully my contribution through my channel will reduce the learning curve duration of many aspiring traders by providing the key information in a concise and enjoyable manner. https://www.youtube.com/channe... more »

Hi gpacker,
without knowing a little bit more about what you are doing it's hard to be too precise, but there are a couple of things I can raise :
1. If you are back-testing, then beware survivorship bias. It is one of my major bugbears that on Stockopedia - as well as every other data provider I am aware of - when any stock de-lists (whether by virtue of being taken private, going bust or taken over) all past data is expunged from the historical record. - It is totally nonsensical imho, but as I say all data providers do exactly the same.
The upshot is that if you are back-testing you may be inadvertently be excluding failures that 'delisted' (whether during your theoretical trade period or later).
2. Daily data - if you want to derive the real 'drawdown' figures you need the daily data for you holding period (and perhaps the daily highs and lows too - dependent on what you want to determine.)
There are two key potential source I would point to :
a. yahoo (finance.yahoo.com) - select any stock and then go to the 'historical data' and you can download the daily OHLC (Open, High, Low, Close) data for any date range you choose.
b. http://alphavantage.co/ provides similar data to yahoo - they position their offering as an 'API' which implies that you need to do a bit of coding to use their site, although in fact if you want to manually extract data it is not that hard.
I have been doing quite a lot of work over the last couple of months to develop my own personal database using these sources (and others) that will also - going forwards- eliminate the survivorship bias mentioned above. If it might be of help, please feel free to send me a private message and if it's not too onerous a request I may be able to provide the information you need.
It would be interesting though to hear a little more of what you have been looking for - accepting of course that the first successful alchemist will not want to share the recipe at an early stage ;-)
Hi Gromley,
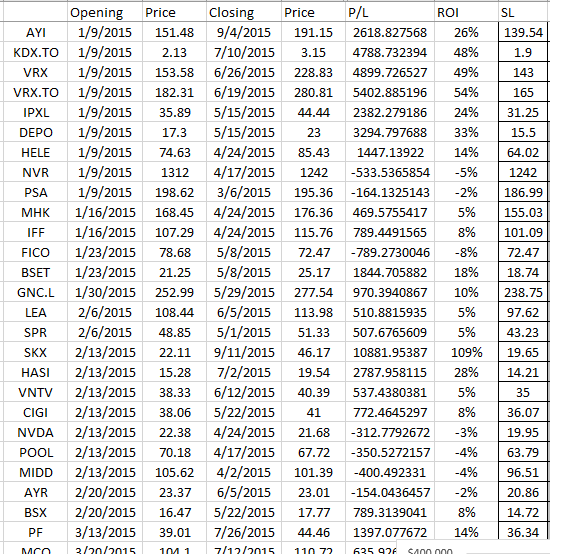
Thanks for the reply, the survivorship bias has not had an impact on any of these (289) particular selections but I fully understand your concerns.
The data used is based on the opening/closing prices of the week - I accept some slippage but due to this system being on a longer time frame I calculate this to be minimal factor on returns in general.
All this in mind, I'm purely looking at the weekly price fluctuations for each stock whilst being held in the portfolio, the curve at present looks very appealing but for me to optimise my risk management/position sizing I need to see these fluctuations to come to a conclusion of maximum drawdown.
cheers
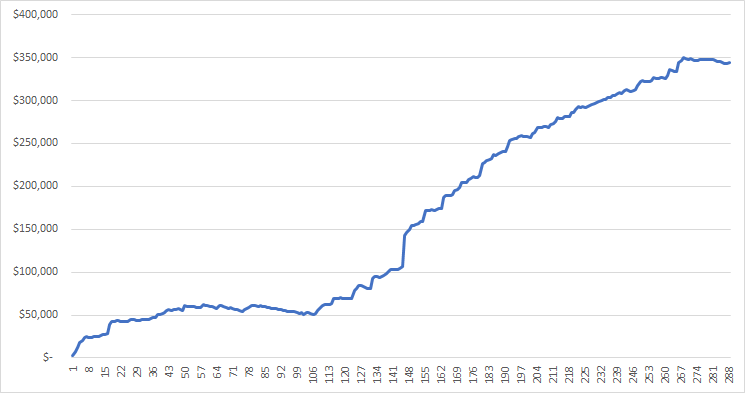
This is the equity profile based on opening and closing price for the duration of holding the stocks, not the fluctuation during the hold period.

As a quick check, you can get Stockopedia to create the plot for you including the intermediate values.
You need a CSV with headings like the following example and with one line per buy or sell. So if your data has the buy and sell on the same line you'll need to do a bit of manipulation to get the required format on a new sheet in your spreadsheet which you then save as a CSV.
Then once the data is imported into a stockpedia folio you can click on Analysis and then Profits to see the returns including any intermediate returns.
For more info on the format see the Stockopedia help when you click on "Import Folio".
Example CSV:
| TICKER | DATE | TYPE | SHARES | PRICE | CURRENCY |
| LON:CARR | 02/01/2019 | BUY | 635 | 158 | GBX |
| LON:BVIC | 02/01/2019 | BUY | 124 | 808 | GBX |
| LON:SBRY | 02/01/2019 | BUY | 382 | 262 | GBX |
| LON:SCS | 02/01/2019 | BUY | 478 | 209 | GBX |
| LON:CCT | 02/01/2019 | BUY | 182 | 550 | GBX |
| LON:RDW | 02/01/2019 | BUY | 205 | 488 | GBX |
| LON:EVR | 02/01/2019 | BUY | 209 | 479 | GBX |
| LON:MNDI | 02/01/2019 | BUY | 61 | 1635 | GBX |
| LON:OCN | 02/01/2019 | BUY | 85 | 1170 | GBX |
| LON:WIN | 02/01/2019 | BUY | 419 | 238 | GBX |
| LON:DTG | 02/01/2019 | BUY | 125 | 797 | GBX |
| LON:PLUS | 02/01/2019 | BUY | 72 | 1382 | GBX |
| LON:MCL | 02/01/2019 | BUY | 633 | 158 | GBX |
| LON:UAI | 02/01/2019 | BUY | 488 | 205 | GBX |
| LON:EMIS | 02/01/2019 | BUY | 109 | 920 | GBX |
| LON:NWF | 02/01/2019 | BUY | 588 | 170 | GBX |
| LON:D4T4 | 02/01/2019 | BUY | 519 | 192 | GBX |
| LON:BT.A | 02/01/2019 | BUY | 417 | 240 | GBX |
| LON:OPG | 02/01/2019 | BUY | 3922 | 25.5 | GBX |
| LON:JEL | 02/01/2019 | BUY | 220 | 455 | GBX |